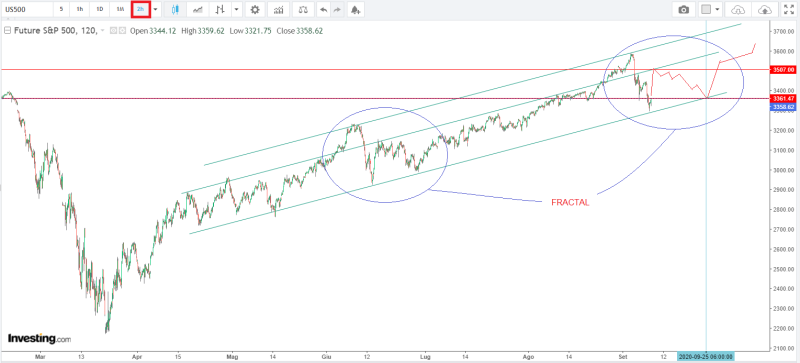
Adam Mancini, a full-time futures trader and an analyst, suggests that the current movement in the S&P 500 will mirror what happened in June.
S&P 500 Repeats the History
Mr. Mancini notes that, in June, there was already a sell-off in shares, which led to a 9% drop in the S&P 500 index, which includes the 500 largest US companies by capitalization. After this downward trend, which was lasted 3 days, there was a return to the previous growth rates, which led the index to new all-time highs.
Price action remains very similar to the June sell-off. In June, $SPX sold off for 3 days and ~9% before a sharp rally. This time it sold off for 3 days ~8% then rallied. If the analog continues, bulls need last nights low to hold, then a chop phase to build a pattern for new highs Adam Mancini via Twitter
According to Mancini, the current situation is absolutely the same: the S&P 500 has been falling again for 3 days, after which it showed growth on Wednesday. If the pattern continues to repeat itself, the market expects another upside spurt that can restore the bull rally in full force.

S&P 500 Sets a New Support Line at $3,400
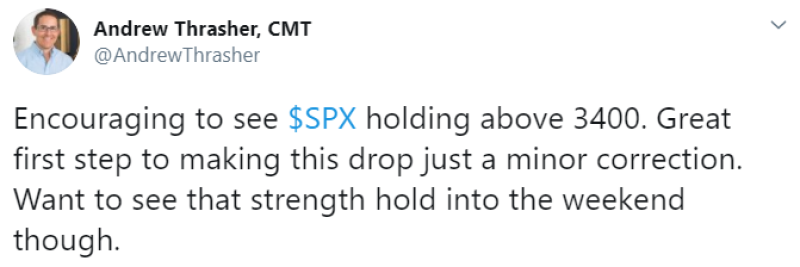
Andrew Thrasher, a portfolio manager for The Financial Enhancement Group, also talks about the positive changes in the behavior of the S&P 500.

During the trading day, the index value was above 3,400 points. If this support line holds up over the weekend, then, according to Mr. Thrasher, the growth will continue and the 3-day fall can be considered to be a slight correction.
 Sergey Diakov

 Sergey Diakov


