Nasdaq's Volatility Index Stair Formation
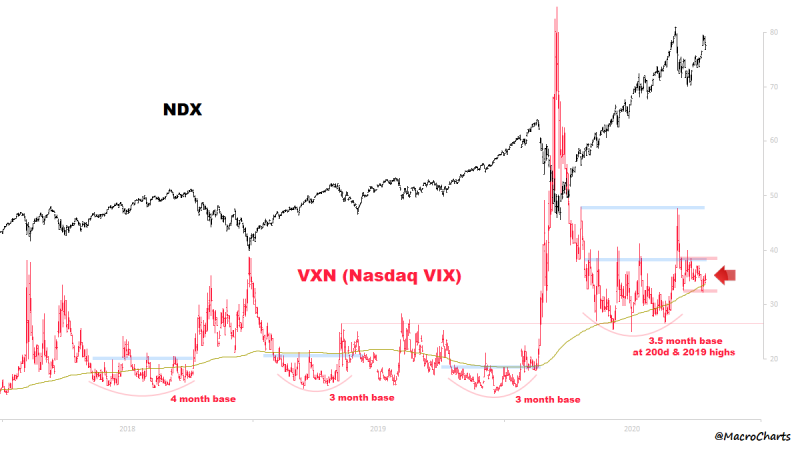
@MacroCharts, a market analyst known for his forecasts, draws attention to the interaction between the Nasdaq and the VXN index, which is responsible for measuring the volatility of the Nasdaq index itself.
High VXN values indicate an increase in the volatility of the market index, and, consequently, an increase in uncertainty among investors. VXN reached its multi-year peak in March 2020, at a time when the market underwent a horrific correction due to the impact of the coronavirus on the global economy.
The most critical Equity chart I'm watching (updated):$NDX Volatility tried to break out – and is forming another very tight pivot at its rising 200d.Possible stair-stepping pattern – a break from this area could trigger a big move (either way) – maybe soon. Watching closely. @MacroCharts via Twitter

@MacroCharts notes the formation of a horizontal corridor on the VXN chart, in which the volatility of the VXN itself is gradually decreasing. He draws the attention of followers to the fact that this is a sign of an imminent change in the index: when the corridor is broken, it will most likely mean a rapid rise or fall in the index. The situation is aggravated by the fact that the VXN volatility index is now at a fairly high level.
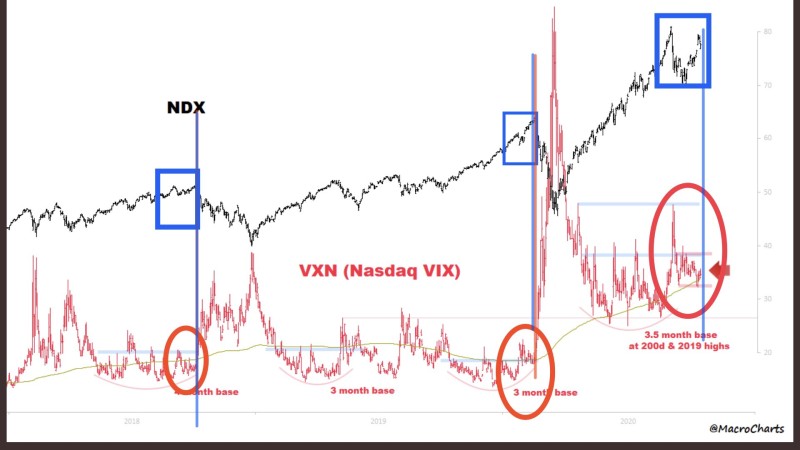
In the comments to the tweet, followers suggested an updated and more visual graph:

It clearly shows that in 2020 the formation of such a staircase was already observed twice. Both times, this formation eventually led to a drop in the index. Perhaps the same is expected a third time. Nevertheless, @MacroCharts himself does not make predictions about which direction the index will move, noting only potential signs of such a movement itself.
S&P 500 Is in the Verge of Fall Too
The analyst had previously made a similar statement regarding another index, the S&P 500. However, those forecasts were more gloomy, as the expert predicted that any large sale could lead to a drop in the entire index. The forecast was made on the basis that despite the overall market rally, which has already generally recovered from the September correction, more than 40% of S&P 500 stocks are still 20 percent or more cheaper than their a 52-week highs.

 Saad Ullah

 Saad Ullah


