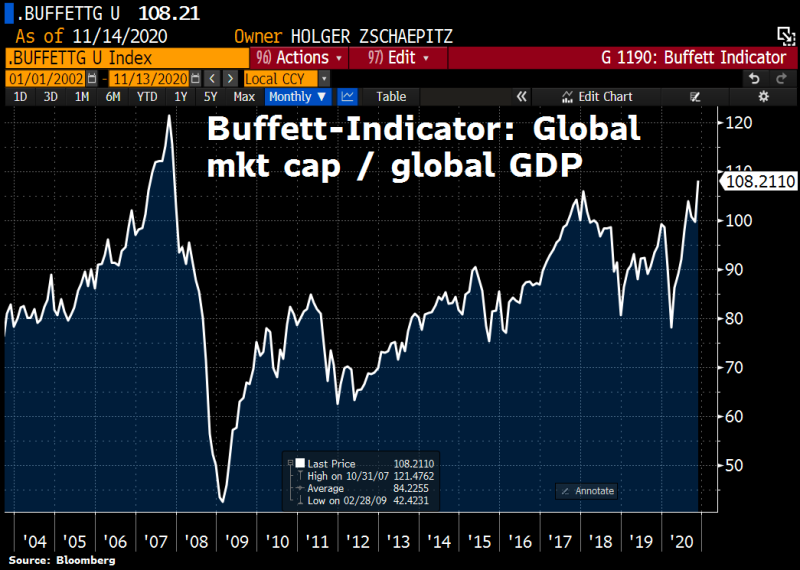
Buffet Indicator Is Far Above 100%
According to Holger Zschaepitz, the market analyst and Die Welt author, the Buffet Indicator has reached its highest value since 2007. The value of this indicator is 108%, thus showing that the market is steadily moving into the zone of inflating a financial bubble.
Equities are moving further and further into the bubble territory, at least measured by the Buffett-Indicator. Global stock mkt cap has hit fresh ATH this week at $95tn, equal to 108% of global GDP, way >100% threshold, and the highest figure since 2007. Holger Zschaepitz via Twitter

What Is the Buffett Indicator
Based on Yahoo Finance information, the Buffett indicator is calculated by dividing the total value of all stocks in the U.S. market by the gross domestic product. The Wilshire 5000 Total Market Index is typically used as a measure of the total U.S. market cap. It is a market-capitalization-weighted index of all US-stocks actively traded in the country.
The average historical value of the index is about 65%, while in the last 8 years the value of the index has consistently exceeded 75%. It is believed that if the indicator value exceeds 100%, it means that the market is overheated. Buffett's indicator has been at 100% and above five times over the past 15 years, with each of them leading to a rapid decline.
Recall that this year Buffett Indicator was above 100% GDP for the first time since 2017. This happened in the summer, during an incredible rally in the stock market, spurred by the stimulus policy of the Federal Reserve.
Now the situation is even more serious because the market continues to plunge more and more into the bubble zone, having already reached 108% of GDP. This happened despite a rather serious correction that took place in early autumn. Then she hurt the biggest companies, benefiting the most from the summer rally. However, the market is now back at its all-time highs after recovering. So, on Friday, the S&P 500 closed at a new all-time high for the first time since September 2.

 Usman Salis

 Usman Salis


