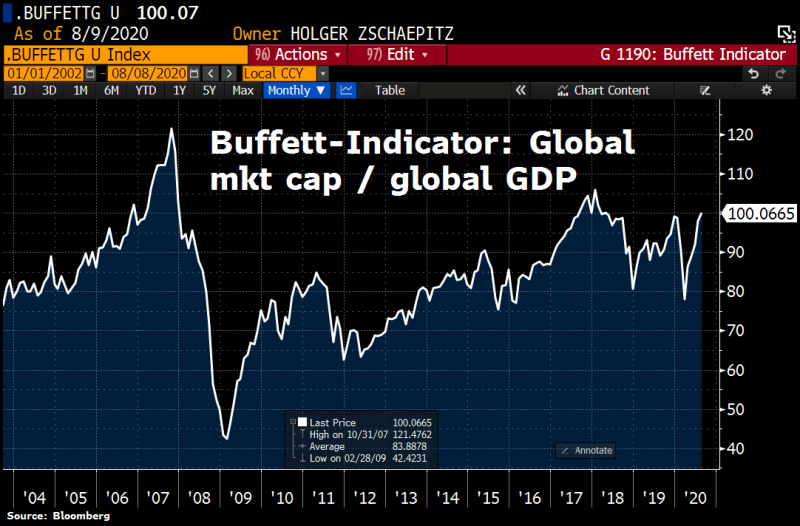
Holger Zschaepitz, an author from Die Welt, reports that the Equity Markets have broken a new record. The total market capitalization of companies exceeded the total GDP for the first time since 2018.
Global stock mkts have hit another milestone. All stocks now worth more than 100% of global GDP for the 1st time since 2018, pointing to stretched valuations. For Warren Buffett, a Market Cap to GDP Ratio >100% means stocks in bubble territory. Holger Zschaepitz
He also emphasizes that this ratio is called the Buffett Indicator.
What is the Buffett Indicator?
According to Yahoo Finance information, Buffett indicator is calculated by dividing the total value of all stocks in the U.S. market by the gross domestic product. The Wilshire 5000 Total Market Index is typically used as a measure of the total U.S. market cap. It is a market-capitalization-weighted index of all US-stocks actively traded in the country.
The average historical value of the index is about 65%, while in the last 8 years the value of the index has consistently exceeded 75%. It is believed that if the indicator value exceeds 100%, it means that the market is overheated. The Buffett's indicator has been at 100% and above five times over the past 15 years, with each of them leading to a rapid decline.

Buffett Buybacks the Stocks of his Berksire Hathaway.
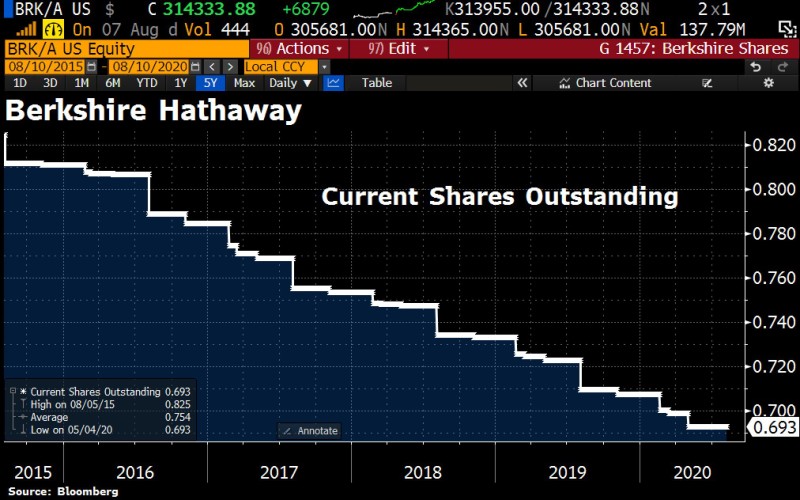
However, this information is related to the news that Warren Buffett’s investment fund Berkshire Hathaway (BRK-A, BRK-B) was engaged in the buyback of its shares in the second quarter. The buyback amount was a record of $5.1 billion. This is twice as many other buybacks taken earlier. Besides, Buffett's fund has unloaded $13 billion of other companies' stocks.
Apparently, because of this, the company's stocks almost missed the rally that took place in the second quarter: the Fund's profitability turned out to be lower than the S&P 500.

 Usman Salis

 Usman Salis


