 Saad Ullah

⬤ The US Dollar Index has shifted into a softer phase after its recent cycle, bringing renewed attention to its historical relationship with tech stocks. Looking at data going back to 1985, there's a clear pattern: whenever the dollar weakened or moved sideways, the Nasdaq pushed higher.
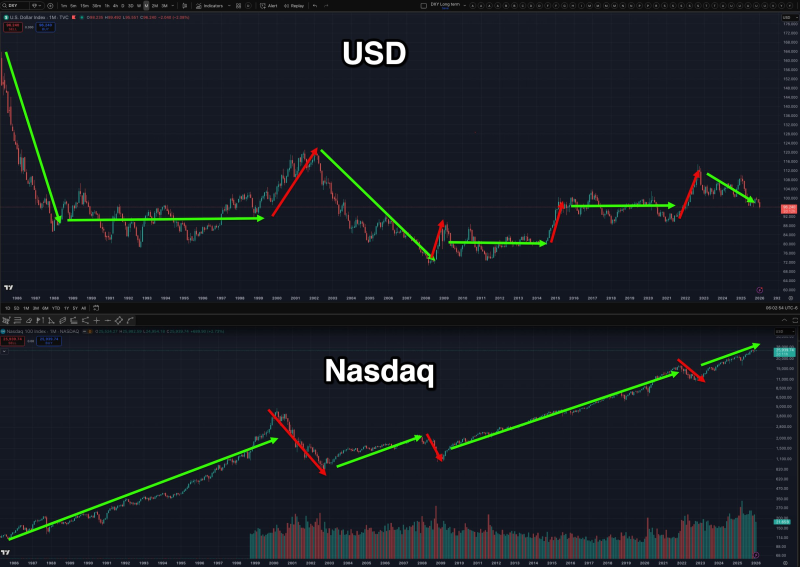
⬤ The chart tracks several major cycles where DXY peaked and then declined, each time followed by extended Nasdaq rallies. This played out in the late 1980s, around the early 2000s, during the post-financial crisis expansion, and through the most recent multi-year equity run. The pattern shows sustained dollar weakness consistently aligned with rising equity prices rather than dragging them down.
Every major instance where the dollar weakened or moved sideways over this period coincided with a strong advance in the Nasdaq.
⬤ Right now, DXY has shifted back into a declining trend after struggling to hold higher levels. Meanwhile, the Nasdaq continues trading in its long-term uptrend. This side-by-side view reinforces what decades of data have shown: when the dollar isn't climbing, equities tend to thrive.
⬤ Currency trends matter because they affect trade competitiveness, corporate earnings from overseas, and global growth. Historically, weaker or flat dollar periods have lined up with stronger equity momentum and expanding economic activity. As markets watch where the dollar heads next, this long-term DXY-Nasdaq relationship remains a key macro signal driving sentiment across global markets.
 Saad Ullah


