 Marina Lyubimova

- USD.CAD Turns Bullish as Pair Fights Back Above Key Moving Averages
- USD/CAD Bounces Back Nicely on 4-Hour Chart With Solid Support Below
- Make or Break for USD/CAD at 1.4015 Resistance Level
- USD/CAD Rally Lacks Strong Volume While Forming a Rising Wedge
- Downside Risks for USD/CAD If 1.3900 Support Gives Way
- Tomorrow's Economic Data Could Spark USD/CAD's Next Big Move
The USD/CAD pair is holding its ground near 1.3975, challenging critical resistance at the 50-day EMA after a strong bounce from the 1.3900 support zone, potentially setting the stage for a significant breakout.
USD.CAD Turns Bullish as Pair Fights Back Above Key Moving Averages
USD/CAD is showing some serious resilience in Wednesday's American session, hanging tough around the 1.3975 mark as bulls try to take back control. The pair showed impressive strength earlier today, bouncing nicely off the critical 1.3900 support area. Looking at the daily chart, things are shaping up pretty well as the pair tests the important 50-day Exponential Moving Average at 1.4030 – a level that's been keeping a lid on things lately.
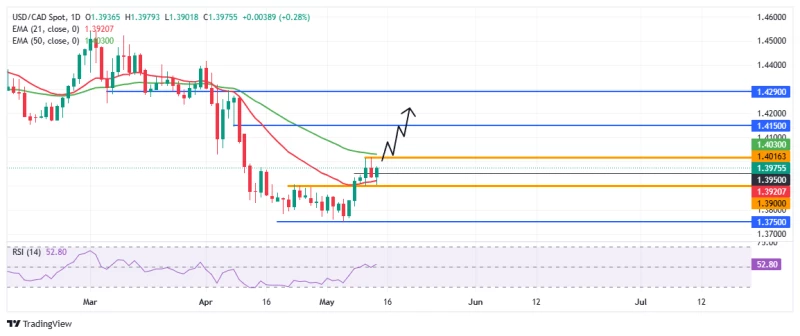
The mood turned decidedly more bullish after USD/CAD managed to close above the 21-day EMA (1.3920) earlier this week, confirming a shift in momentum. Chart watchers note that if we get a solid break and daily close above the 50-day EMA, we could see a breakout from the recent sideways action, potentially opening the door to further gains toward 1.4150 and maybe even April's high near 1.4290. Right now, the RSI on the daily chart sits at a modest 52, showing some bullish lean without getting into the danger zone of being overbought.
USD/CAD Bounces Back Nicely on 4-Hour Chart With Solid Support Below
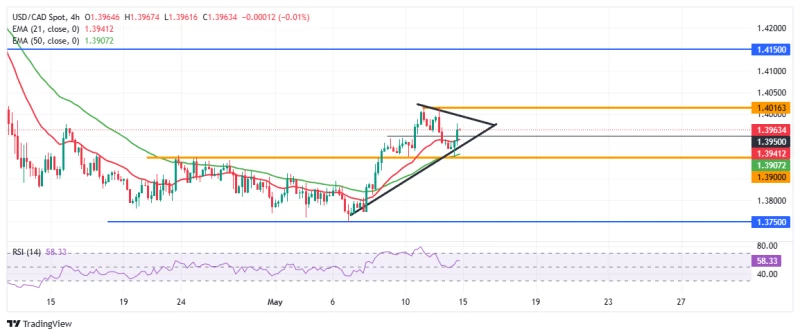
Zooming in to the 4-hour chart shows a pretty impressive recovery for USD/CAD after bouncing off support at the 50-period EMA near 1.3905. Since that bounce, the pair has climbed back above the 21-period EMA at 1.3940, creating what traders love to see – a bullish moving average crossover. This technical development has bulls feeling pretty confident about the near-term outlook.
Worth noting is the clean bottom USD/CAD formed during the Asian session at 1.3901, which now acts as a short-term floor alongside that 50-period EMA. The RSI on the 4-hour chart has climbed to 60.10, well into bull territory but with plenty of room to run before things get overheated – suggesting we could see more upside from here.
Make or Break for USD/CAD at 1.4015 Resistance Level
The immediate hurdle for USD/CAD sits at 1.4015, marking both May's high and a spot where sellers stepped in previously. Traders are keeping a close eye on this level, as a decisive break above would likely confirm the bullish case and potentially send the pair toward the 1.4070-1.4100 zone, an area where we saw selling pressure in early April.
That said, if the pair fails to punch through 1.4015 on its next attempt, we could be looking at a double-top formation. This would leave USD/CAD vulnerable to another test of the important 1.3900-1.3910 demand zone that's been holding things up so far.
USD/CAD Rally Lacks Strong Volume While Forming a Rising Wedge
One interesting thing about the current USD/CAD rally is that it's happening on somewhat modest volume, suggesting this move might be more about shorts covering their positions rather than aggressive new buying. Structure-wise, the pair is trading inside what chart technicians call a rising wedge pattern – typically seen as either a continuation or reversal setup depending on which way price eventually breaks.
Additionally, the 1.3900-1.3930 area represents former resistance that's now acting as support, backed by horizontal demand and a cluster of moving averages. Market veterans emphasize that holding above this zone is crucial for keeping the short-term bullish outlook intact.
Downside Risks for USD/CAD If 1.3900 Support Gives Way
While things look constructive in the near term, there are still some downside risks for USD/CAD. The 1.3900 mark remains a critical pivot, also lining up with the neckline of the recent consolidation pattern. Chart analysts warn that a solid break below this support could bring in fresh selling and potentially drag the pair back toward April's lows around 1.3750.
Such a bearish turn would likely kill the current bullish setup and point to a broader reversal of the recent recovery. Smart traders are staying cautious with position sizing until we get a clearer directional signal either above 1.4030 or below 1.3900.
Tomorrow's Economic Data Could Spark USD/CAD's Next Big Move
Market players will be watching Thursday's economic releases like hawks for potential catalysts that could determine USD/CAD's next move. Tomorrow brings us the US Producer Price Index (PPI) and Retail Sales figures, along with Canadian Housing Starts data – all high-impact events that could trigger either a confirmed breakout or a reversal from current levels.
These economic indicators will shine a light on conditions in both the US and Canadian economies, potentially shifting expectations around central bank policies and, by extension, where these currencies might be headed next. Savvy traders will likely wait for these data points before making any big bets on USD/CAD's direction.
 Marina Lyubimova


