 Usman Salis
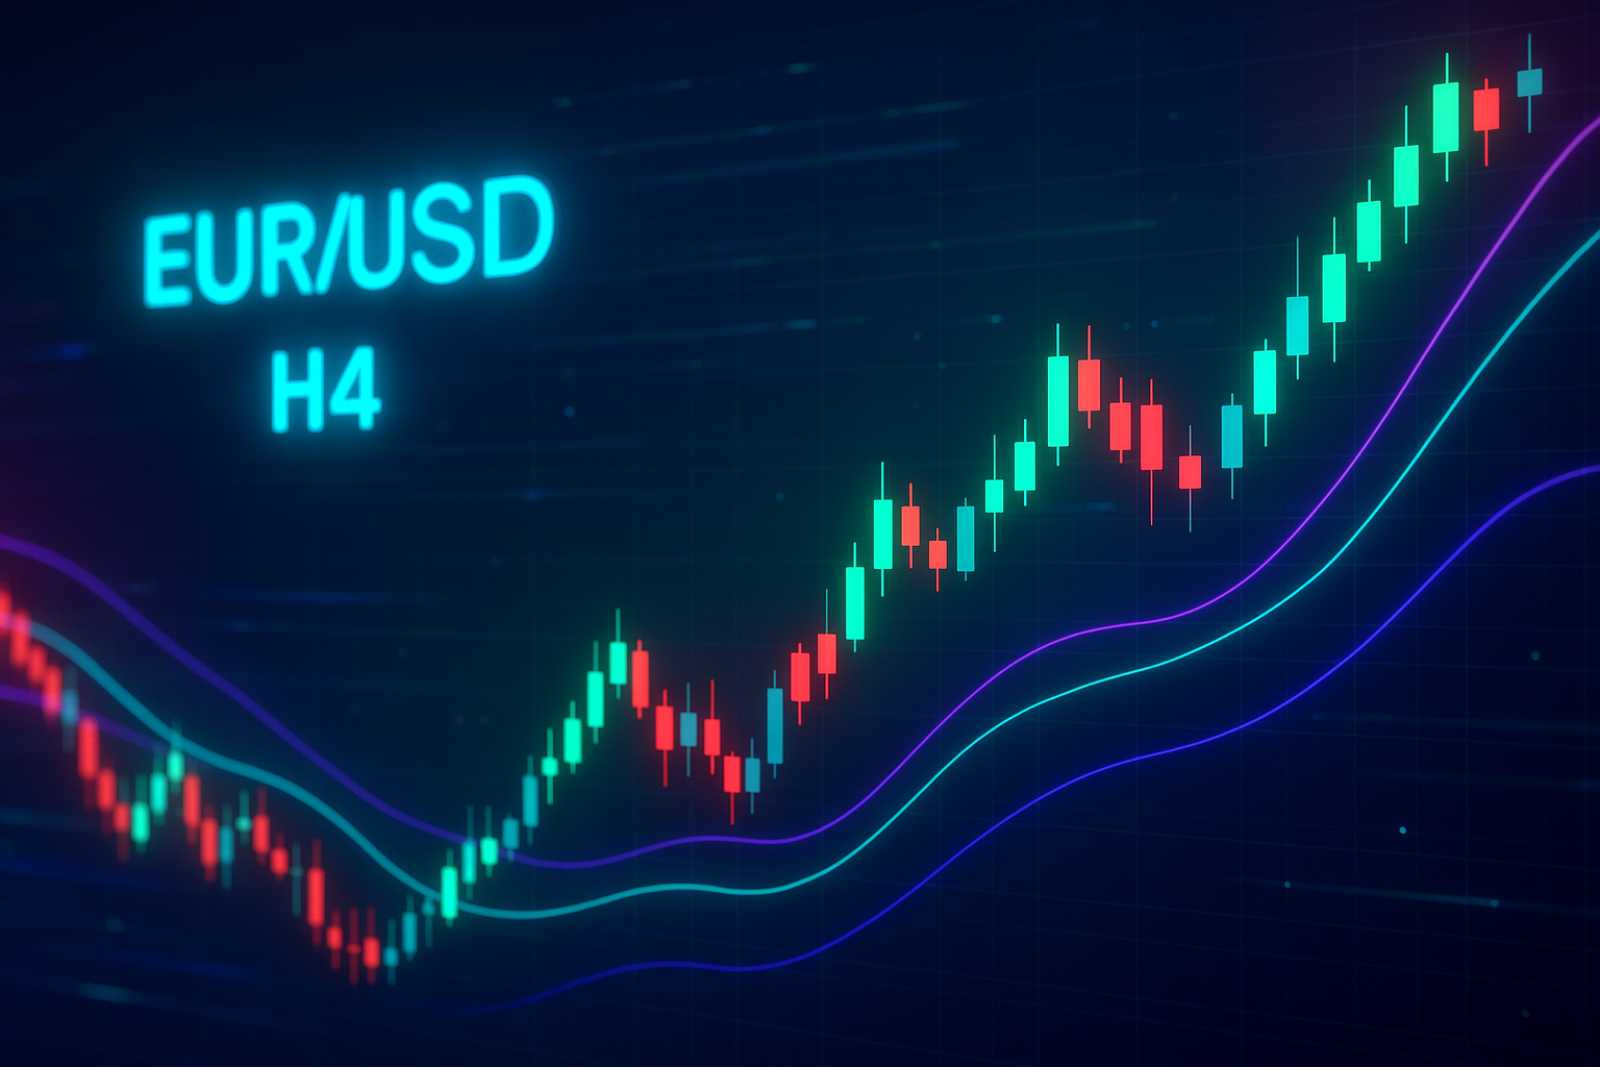
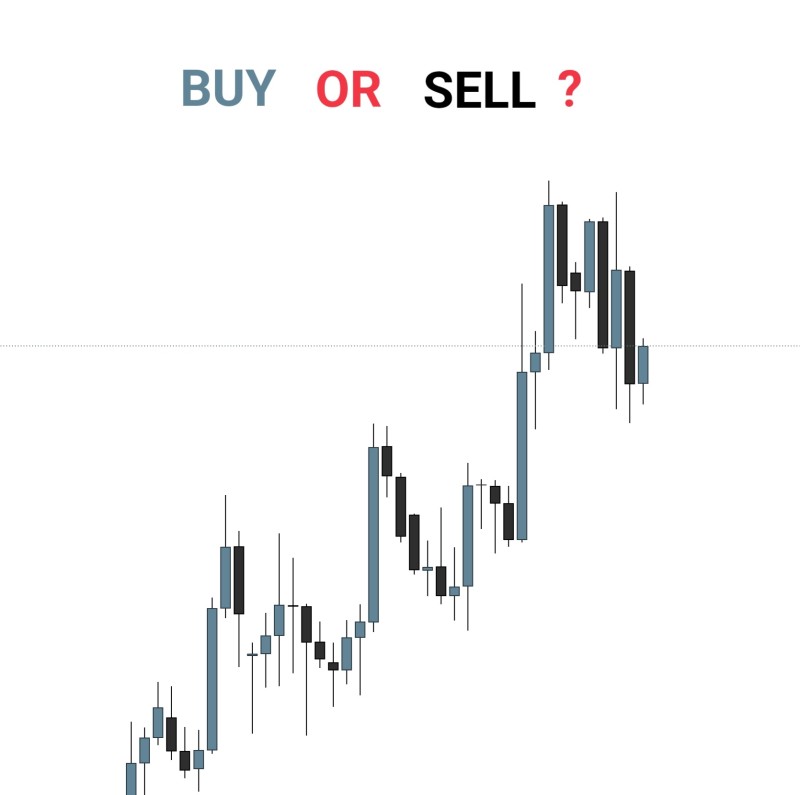
⬤ EUR/USD is back in the spotlight after a fresh H4 chart sparked debate about whether the pair is setting up for a buy or a sell. The chart shows EUR/USD moving within a broader upward structure, but recent candles reflect hesitation near a short-term consolidation zone—leaving traders to decide which way the next move breaks.
⬤ The chart reveals EUR/USD climbing through higher highs and higher lows in a clear bullish pattern. But the latest price action shows a pullback from the recent local high, forming a tight cluster of candles that suggests momentum is slowing. This kind of formation typically shows up when the market is pausing—either before continuing higher or setting up for a near-term correction. The structure suggests EUR/USD is sitting near the midpoint of its recent swing.
⬤ Right now, EUR/USD is sitting at an equilibrium point where directional clarity is limited. Traders are interpreting the setup through their own strategies, which is fueling the debate about where the pair heads next. The chart intentionally leaves the question open, inviting market participants to weigh in on their outlook.
⬤ This matters because EUR/USD is one of the most-watched currency pairs and often reflects broader economic sentiment between the eurozone and the U.S. When the pair stalls at a structural turning point like this, the next move can set the tone for near-term volatility and momentum shifts. As the chart suggests, liquidity and direction should become clearer once the pair picks its path.
 Usman Salis


