 Usman Salis

⬤ CAD/JPY recently retraced into a critical support region known as the "blue box" in Elliott Wave analysis. The short-term pullback hit this zone last week and triggered a bullish bounce that aligns with the prevailing uptrend. The chart emphasizes trading with the broader bullish bias rather than fighting the trend, as long as the pair holds above key structural levels.
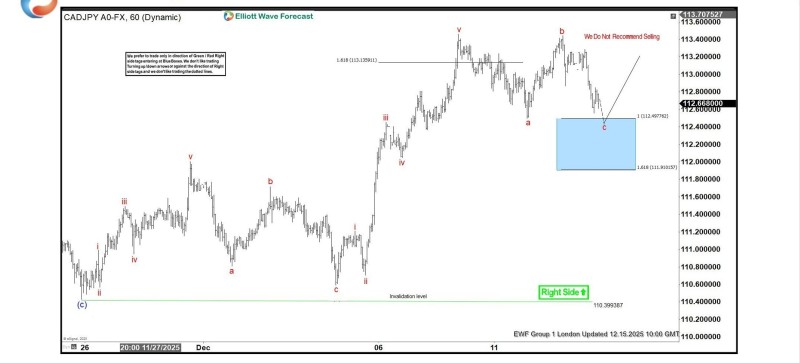
⬤ The Elliott Wave structure shows a completed five-wave rally followed by a corrective move that ended inside the blue box zone between 112.5 and 112.0. This area has historically sparked upside reactions within this methodology. The chart notes "We Do Not Recommend Selling," highlighting the focus on continuation setups while the dominant directional bias points higher—unless price breaks below the invalidation level.
⬤ CAD/JPY continues respecting its uptrend pattern, with the reaction from support showing dip-buyers remain active. The preferred approach stays aligned with the bullish structure while watching the invalidation level beneath prior lows as the key risk marker.

⬤ This matters because CAD/JPY has shown relative strength among yen pairs recently. The successful bounce reinforces bullish sentiment and signals that buying interest holds firm during pullbacks. Traders may continue viewing dips into defined support zones as significant opportunities within the trend, while staying alert for any structural shifts that could change the outlook.
 Usman Salis


