 Saad Ullah

- AUD/USD Trapped in Sideways Pattern as Trade Jitters Linger
- China's Economic Moves Keep AUD/USD Traders on Their Toes
- AUD/USD Caught in Central Bank Tug-of-War
- Betting Against the Aussie Losing Steam, Positioning Data Shows
- Chart Patterns Reveal Key AUD/USD Levels to Watch
- What's Next for AUD/USD? All Eyes on Trade Talks and Data Dumps
The Aussie dollar retreated from the stubborn 0.6500 ceiling on Wednesday even as the USD lost ground, with traders eyeing the murky future of US-China trade talks.
AUD/USD Trapped in Sideways Pattern as Trade Jitters Linger
The Aussie took a step back on Wednesday, giving up some of Tuesday's rally despite the generally softer US dollar. After another failed attempt to crack the tough 0.6500 barrier, the pair drifted back toward its 200-day moving average around 0.6460.
Traders seem to be getting cold feet about the freshly-inked US-China trade deal, particularly wondering how long it might last and whether it's anything more than a band-aid solution. Any real breakthrough here could give the Aussie a nice boost, considering Australia's economy is practically joined at the hip with China's.
The pair's bouncing around reflects the messy mix of global trade worries, central banks moving in different directions, and chart patterns that traders can't ignore when placing their bets on the Aussie's next move.
China's Economic Moves Keep AUD/USD Traders on Their Toes
China's economy remains the elephant in the room for AUD/USD traders. The People's Bank of China has recently rolled out a grab bag of stimulus measures to prop up its sputtering economy. Just last week, they trimmed the 7-day reverse repo rate, cut bank reserve requirements, opened up lending quotas, and slashed rates for specific sectors.
Fresh inflation numbers from China paint a worrying picture – prices barely inched up by 0.1% month-on-month in April, while the yearly figure actually dipped 0.1%. That's a red flag signaling deflation risks still lurk beneath the surface, despite baby steps toward fixing the US-China trade spat.
When China sneezes, Australia catches a cold – that's why PBoC decisions and Chinese economic health are make-or-break factors for AUD/USD traders. The cautious approach from Beijing suggests they're worried about growth momentum, which could cap the Aussie's upside potential in the coming weeks.
AUD/USD Caught in Central Bank Tug-of-War
The Fed and RBA seem to be reading from different playbooks, and that's throwing AUD/USD for a loop. While both central banks have kept rates steady, their signals couldn't be more different.
Fed Chair Powell is taking a wait-and-see approach with a slightly hawkish undertone, emphasizing patience while they digest incoming data. Meanwhile, RBA's Bullock is pointing to sticky inflation and a tight job market as reasons to keep rates parked at 4.10%.
Markets are still penciling in a possible 25-point cut from the RBA at their May 20 meeting, though bets on aggressive easing have cooled off. Traders now expect about 125 points in cuts over the next year – scaled back from earlier predictions.
Across the Pacific, soft April inflation has some traders starting to bet on a September Fed rate cut. This policy mismatch creates a tricky backdrop for anyone trying to figure out where the AUD/USD is headed next.
Betting Against the Aussie Losing Steam, Positioning Data Shows
The smart money seems less bearish on the Aussie these days. CFTC data through May 6 shows that bets against the Australian dollar have dropped to an eight-week low of roughly 48,300 contracts. The slight dip in open interest hints that sentiment might be stabilizing.
This shift in positioning could mean traders are warming up to the Aussie's prospects, especially if US-China trade tensions keep cooling and Australia's economic numbers support the RBA's cautious stance.
Chart Patterns Reveal Key AUD/USD Levels to Watch
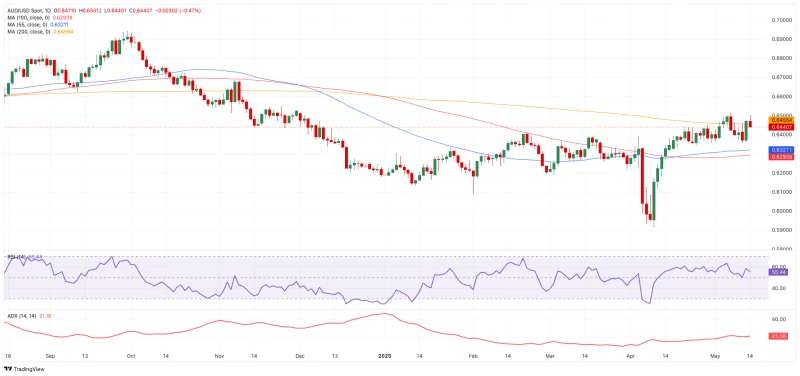
From a chart perspective, clearing the 200-day moving average would brighten the outlook for AUD/USD considerably. Keep an eye on resistance at 0.6514 (this year's high from May 7) and 0.6687 (November's peak) for potential breakout opportunities.
On the flip side, the 55-day moving average at 0.6319 and the 100-day at 0.6293 should provide some cushion if sellers take control. A drop below these could open the trapdoor to this year's bottom at 0.5913, or in a worst-case scenario, the pandemic low near 0.5506.
Momentum indicators are giving off cautiously bullish vibes, with the RSI pushing above 55 and the ADX holding steady near 22. These readings suggest a modest uptrend might be brewing, though the pair needs to bust through key resistance to confirm the bulls are truly in charge.
What's Next for AUD/USD? All Eyes on Trade Talks and Data Dumps
Looking ahead, several wildcards could shake up the AUD/USD in the coming weeks. How the US-China trade saga unfolds remains critical, given Australia's reliance on Chinese appetite for its exports.
Upcoming economic releases from both countries will be under the microscope for clues about central bank moves. Australia's jobs data and inflation readings will be crucial for gauging the RBA's next step, while US retail sales, factory output, and inflation will shape Fed expectations.
For now, AUD/USD seems stuck in a holding pattern, with 0.6500 acting as a stubborn ceiling. A convincing break above could signal a sustained recovery for the Aussie, while another rejection might keep the pair range-bound or vulnerable to renewed selling if global risk appetite takes a hit.
 Saad Ullah


