Peter Smith

XRP is entering a critical late-cycle phase, with price closing below its 200-week EMA - a signal that has historically appeared before a final downside move. The chart reflects a familiar structure, where temporary recoveries fail to hold and lead into one last decline.
The XRP EMA Signal That Repeats Across Cycles
According to ChartNerd, closes below the 200-week EMA have historically acted as an early warning for a final cycle low. The chart shows XRP currently trading beneath this long-term moving average, marking a clear structural shift.
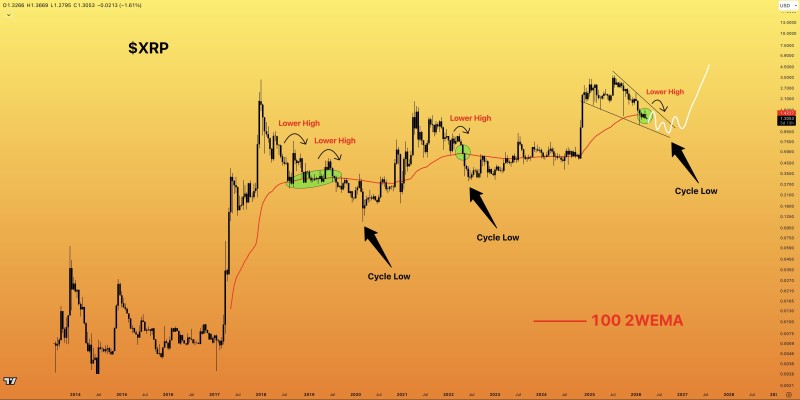
Closes below the 200-week EMA have historically acted as an early warning for a final cycle low - and the current setup is following that same script.
In prior cycles, this condition did not immediately produce the bottom, but instead preceded a sequence of reactions before the final move lower. This behavior highlights the importance of the 200-week EMA as a long-term trend filter - one that separates genuine recoveries from dead-cat bounces.
For those tracking XRP tests major resistance near 200 EMA signaling key decision zone, this recurring dynamic is nothing new - but it remains as relevant as ever.
Lower Highs Continue to Define XRP Structure
A consistent feature across the chart is the formation of lower highs following rebounds. Each rally attempt stalls below previous peaks, reinforcing a downward structure even during periods of recovery.
Every bounce attempt stalls below the prior peak - that pattern of lower highs is the market telling you the trend hasn't changed yet.
The repeated pattern visible on the chart reflects:
- Initial bounce from the moving average
- Failure to sustain upward momentum
- Formation of lower highs before continuation
This aligns with broader XRP behavior, where price often struggles near key moving averages before resolving directionally. Traders watching XRP final dip setup before potential rally emerges will recognize this two-step dynamic playing out in real time.
The XRP Setup for a Final Sweep Lower
The structure outlined in the chart suggests a typical late-cycle sequence: a rebound attempt from current levels, a rejection forming another lower high, followed by a final move lower marking the cycle bottom.
This pattern has been observed in multiple XRP scenarios, where the market undergoes one last decline before transitioning into a new phase. Similar setups have previously pointed to a final dip before potential rally, reinforcing the idea of a two-step process rather than a straight-line recovery.
Once the final sweep completes and accumulation kicks in near cycle lows, the shift in momentum tends to be fast and significant - that's historically when XRP makes its biggest moves.
Why the 200-Week EMA Remains Critical for XRP
The 200-week EMA remains the defining level in the current structure. As long as XRP trades below it, the market continues to reflect late-cycle weakness rather than confirmed reversal. The chart suggests long-term structure has weakened, lower highs remain intact, and a final downside move is still possible.
At the same time, historical behavior shows that once this phase completes, the following move can shift momentum significantly - especially if accumulation begins near cycle lows. Those monitoring XRP whale accumulation signals underlying positioning shift may already be seeing early signs of that process playing out beneath the surface.
 Peter Smith