 Saad Ullah
XRP (Ripple) has once again captured the attention of traders as it hovers just below a critical resistance level near $2.20. The daily candle formation on the XRP chart appears unusually flat—almost as if the price hasn't moved at all. This rare stagnation comes right under a long-term descending trendline, raising questions about whether XRP is gearing up for a major move—or bracing for a rejection.
XRP Price Pauses at Resistance
According to a post by well-known trader @DefendDark on Twitter, XRP (XRPUSD) has printed an unusually still daily candle—one that appears “as if it has never moved.” This rare price behavior comes just under a descending resistance trendline and within the Ichimoku Cloud, signaling potential indecision among traders.
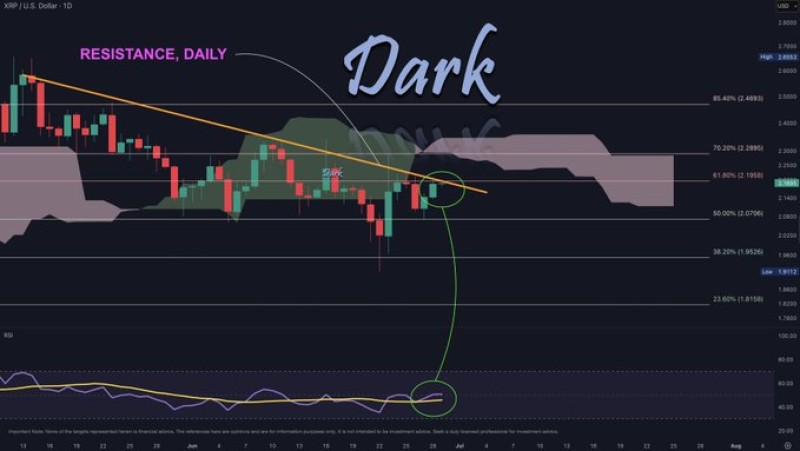
The chart shows that XRP currently sits just below the $2.20 resistance, brushing against the 61.8% Fibonacci retracement level (~$2.13). Price action suggests consolidation, with low volatility and tight trading range. Such patterns often precede explosive moves in either direction.
Technical Indicators Signal a Turning Point
The Relative Strength Index (RSI), highlighted at the bottom of the chart, remains near oversold territory and is beginning to curl upward. This divergence from price action could imply a bullish reversal if confirmed by volume and a breakout above the Ichimoku Cloud.
However, if XRP (XRPUSD) fails to reclaim the $2.20 level and gets rejected again, a potential retest of the $1.89 or even the $1.61 Fibonacci levels may follow. The trader’s chart underscores how critical this zone is for bulls to maintain upward momentum.
Conclusion
XRP's price action is currently balanced on a knife’s edge. The strange stillness in today's candle beneath daily resistance reflects a market in wait. Whether this leads to a breakout or a rejection will likely define XRP’s short-term trend. As Dark Defender pointed out, "Just a scratch" may be all it takes to spark the next big move.
 Saad Ullah


