 Saad Ullah

⬤ XRP is coming back to test a critical structural level on the monthly chart as price action returns to its major breakout zone. Holding this area into the monthly close is being watched closely after the asset wrapped up a strong cycle rally. The chart shows XRP pulling back toward the $2.00 region, where it's potentially retesting the previous resistance line after a sharp run-up earlier this year.
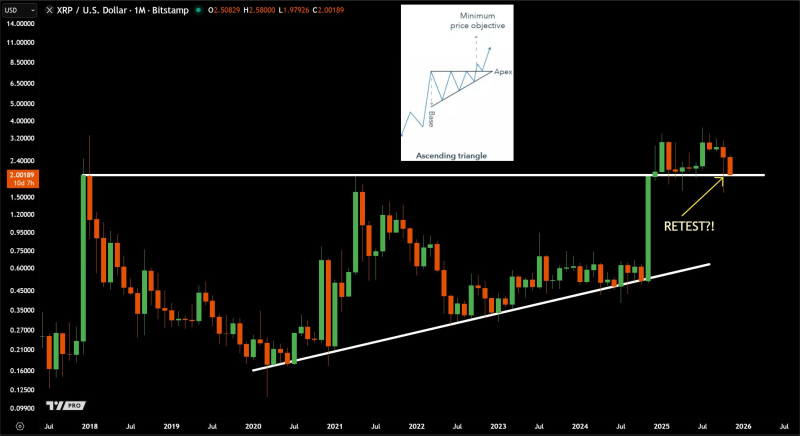
⬤ The technical setup shows a long-term ascending triangle pattern that's been forming since 2018 all the way through 2024, with a flat resistance level sitting near $2.00 and a rising trendline propping up multiple higher lows. XRP eventually busted through this structure with a massive upside candle, hitting a high around $3.37. Some traders who got in near $0.28 and got out near $3.37 managed to lock in roughly a 12x move during the cycle.
The chart shows XRP pulling back toward the $2.00 region, where a potential retest of the previous resistance line is developing following a sharp upward expansion earlier in the year."
⬤ Recent monthly candles show XRP sliding back toward what used to be resistance and is now acting as potential support. The technical diagram highlights the ascending triangle structure and its projected minimum price target, backing up just how significant this long-term breakout really is. The chart suggests XRP is trying to confirm this structural shift by holding steady above the old ceiling, even though price has dipped lower recently.
⬤ How XRP handles this major technical zone matters because confirmation here could strengthen the broader cycle structure that's been building for years. Keeping support around the breakout point would line up with the momentum and keep the ascending triangle pattern intact. But if this area doesn't hold, it could shift market sentiment and change how traders are reading XRP's next move within its multi-year trend.
 Saad Ullah


