 Eseandre Mordi

⬤ XRP is currently trapped in a narrowing triangle formation around $2.05, with price action steadily compressing between converging trendlines. The pattern shows several weeks of tightening volatility, with each swing becoming progressively smaller as the asset approaches a potential breakout point.
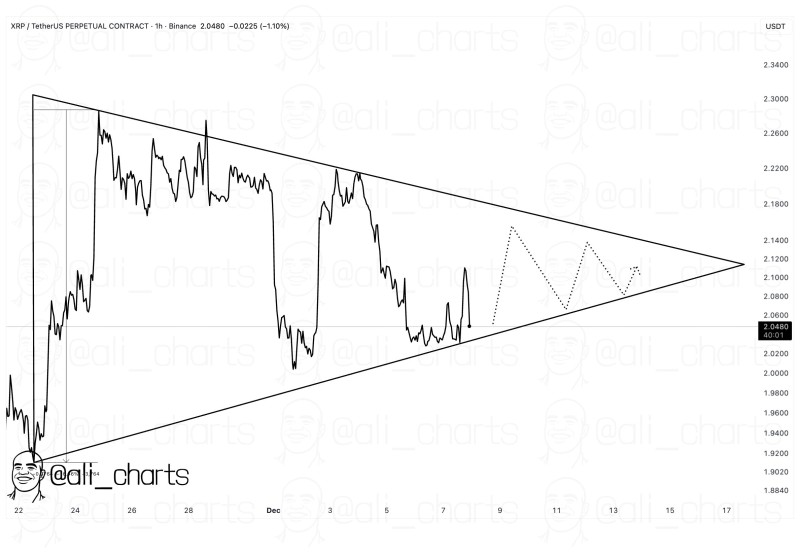
⬤ The structure features a clear descending resistance line formed by lower highs and an ascending support line built from higher lows. XRP has been bouncing between roughly $2.18 and $1.98, but these swings are getting tighter with each passing session. Chart projections suggest the pattern could deliver a 16% move once price finally breaks out of this consolidation zone.
⬤ Recent trading shows XRP testing both boundaries without committing to either direction yet. This late-stage compression is textbook triangle behavior—volume dries up, price ranges shrink, and the market essentially coils up before the next significant move. Traders are watching the $2.10 area closely, along with any dips back toward the lower trendline, as these zones will likely determine which way the breakout unfolds.
⬤ Triangle patterns like this matter because they often mark the calm before the storm. The longer the consolidation, the bigger the eventual move tends to be. With a 16% projection on the table, this setup is drawing attention from traders looking to position ahead of XRP's next directional push. Whether it breaks up or down, the compression suggests volatility is about to return in a meaningful way.
 Eseandre Mordi


