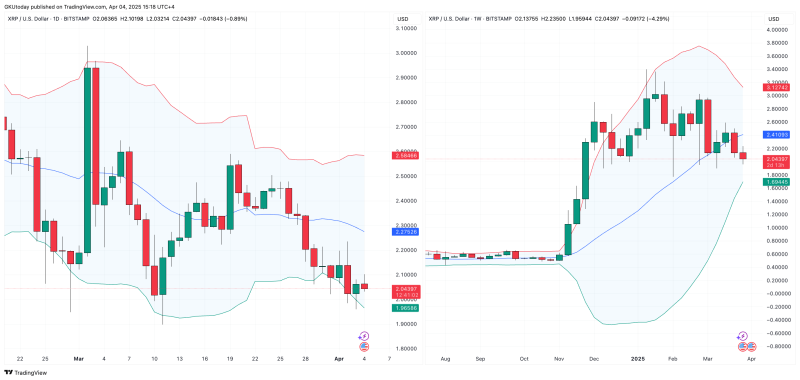
XRP shows signs of an imminent price movement as Bollinger Bands tighten, suggesting a significant breakout could occur in either direction for the popular cryptocurrency.
XRP Weekly Chart Signals Potential Downside Risk
The current XRP price action presents a complex scenario for traders and investors. According to Bollinger Bands analysis, the weekly chart shows the lower band positioned at $1.696. If XRP reaches this level, it would indicate that the cryptocurrency has succumbed to broader market fatigue, potentially entering a phase where support levels are tested and investors with less conviction may exit their positions.
This wouldn't necessarily represent a market crash for XRP, but rather a gradual decline that might raise questions about whether the digital asset is losing momentum. This scenario represents just one potential outcome based on the weekly timeframe analysis.

Daily XRP Chart Offers More Optimistic Outlook
Contrary to the weekly chart's potential bearish signals, the daily timeframe presents a more encouraging picture for XRP holders. The middle Bollinger Band on the daily chart is positioned at $2.275. Should XRP manage to gather sufficient market strength to push toward this level, it would suggest that the recent sideways price action was merely a temporary pause rather than the beginning of a downtrend.
While reaching this level wouldn't necessarily trigger an explosive upward movement, it would represent a steady return to a more favorable price range for XRP. This would provide bulls with increased confidence and potentially set the stage for continued upward momentum.
XRP Volatility Squeeze Indicates Major Move Ahead
What makes the current XRP price action particularly noteworthy is the tightening of the Bollinger Bands across timeframes. This classic "squeeze" pattern typically precedes a significant price movement in either direction. The key question isn't whether XRP will break out of its current range, but rather which direction it will choose when the breakout occurs.
If XRP drops to the $1.696 level, it would confirm bearish control of the market, at least in the short term. Conversely, a rally to $2.275 would give bullish investors reason for optimism and potentially open the door to further gains.
Trading Strategy for XRP During Band Squeeze
For traders and investors monitoring XRP in the current market environment, the strategy remains straightforward but requires discipline. It's essential to closely monitor the Bollinger Bands and trading volume for confirmation of the eventual breakout direction. Most importantly, market participants should avoid making assumptions about the future price direction until XRP clearly establishes its next trend.
The contrasting signals between the weekly and daily timeframes create an interesting dynamic that underscores the importance of multi-timeframe analysis when trading volatile assets like XRP. As the Bollinger Bands continue to tighten, traders should prepare for increased volatility while maintaining appropriate risk management protocols.
The developing technical pattern suggests that XRP's next significant move could be decisive in establishing the medium-term trend for the cryptocurrency, making this a crucial period for both short-term traders and longer-term investors in the XRP market.
 Usman Salis

 Usman Salis


