Peter Smith
XRP's recent price action has traders watching closely as the market executes what looks like a classic liquidity grab. This sharp move downward appears designed to shake out weaker positions before the next directional play unfolds.
What the Chart Shows
Crypto analyst EGRAG CRYPTO compared the current setup to a bus racing blindfolded at 100 miles per hour—a fitting description given the uncertainty surrounding U.S. fiscal policy, geopolitical tensions, and the broader question of where global liquidity flows next.
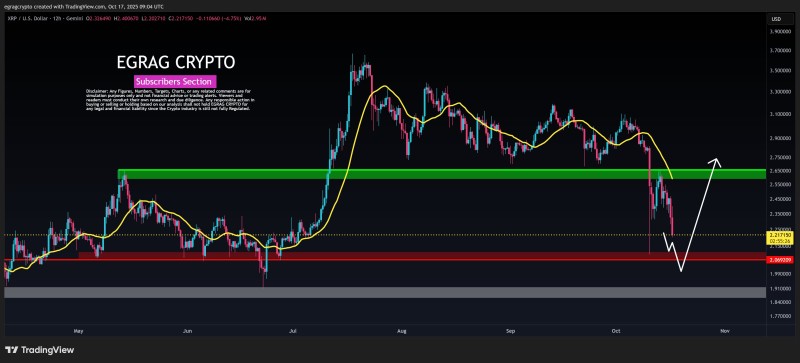
The 12-hour Gemini chart reveals XRP/USD dipping toward $2.20, filling in previous wicks and testing lower liquidity zones. This type of "stop hunt" often precedes a bounce, though nothing is guaranteed in crypto.
Key levels to watch include:
- Support Zone: Strong buying interest sits around $2.05–$2.10. If this area holds, it could mark a short-term low and set up a reversal.
- Resistance Zone: On the upside, $2.60–$2.70 represents the first major hurdle. A clean break above this range would signal buyers are regaining control.
- Trend Indicator: The yellow moving average reflects recent bearish momentum, but a recovery toward $2.70 remains possible if the liquidity sweep completes and buyers step in.
The chart suggests a potential scenario where XRP dips into support before bouncing back toward resistance, which aligns with the liquidity grab idea that's been circulating among traders.
Bigger Picture Factors
XRP doesn't trade in a vacuum. Several macro forces are influencing crypto markets right now. U.S. fiscal uncertainty continues to weigh on sentiment, with ongoing debates around government funding and policy direction creating hesitation among investors. Geopolitical friction between major powers—particularly involving the U.S., China, and Russia—adds another layer of risk that traders are pricing in. Meanwhile, speculation about potential quantitative easing from central banks could provide a tailwind for risk assets like XRP if liquidity conditions improve. There's also been an interesting shift in gold markets recently, with a 40-day rally that some analysts have compared to meme coin behavior, raising questions about whether capital might soon rotate into higher-risk assets including cryptocurrencies.
 Peter Smith