Saad Ullah

The latest XRP/USD weekly charts comparing 2017 and 2025 show a pattern many retail traders recognize: panic selling frequently comes just before strong recoveries. The question now is whether XRP will follow the same path it took eight years ago.
Comparing 2017 and 2025 Price Action
"It's only over when you sell." This insight from crypto analyst STEPH IS CRYPTO captures something fundamental about market psychology—how selling in fear often happens right at the bottom. Back in early 2017, XRP sat around $0.005 for months while traders lost hope. The mood was grim, and plenty of people called the market finished. Then, almost without warning, XRP exploded upward by over 10,000%, pushing past $0.25 before pulling back.
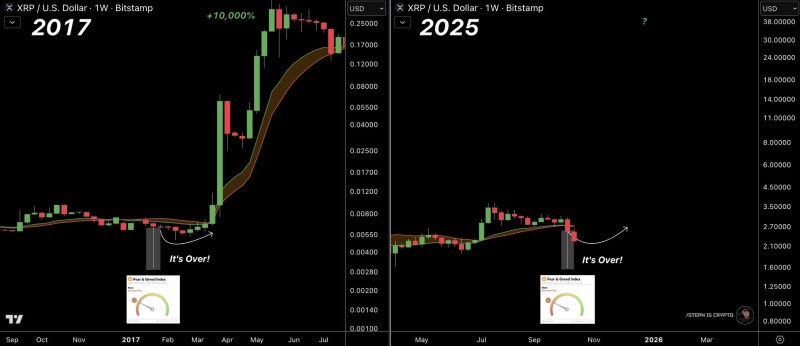
Jump to 2025, and the setup looks oddly familiar. XRP recently dropped into extreme fear territory, with weekly candles testing critical support between $2.00 and $2.70. Once again, the crowd is saying "It's over!"—the same despair that showed up in 2017 right before the massive run-up started.
Technical Levels to Watch
- Support Levels: The $2.00–$2.70 range is the key battleground right now. If XRP holds here, it could bring stability and attract new buyers looking for entry points.
- Resistance Zones: Any upward move will likely hit friction around $3.50 and $4.50. If a bigger cycle rally develops, price targets between $11 and $14 come into play.
- Fear & Greed Index: The index currently shows "extreme fear," matching the sentiment stage from 2017 that came just before XRP's parabolic surge.
- Moving Averages: Weekly candles are pushing against the moving average band. In 2017, this kind of setup preceded a sharp breakout.
Regulatory clarity around Ripple's ongoing legal situation remains a major factor that could unlock institutional money. XRP's growing use in international payments adds genuine demand beyond speculation. And historically, altcoins like XRP tend to rally hard following Bitcoin halvings and broader liquidity increases in the market.
 Saad Ullah