Marina Lyubimova

⬤ Solana (SOL) continues trading within a well-defined ascending triangle structure on the two-week timeframe, showing solid stability after testing rising support. SOL recently bounced from the lower boundary of the pattern, reinforcing the importance of the ascending trendline that's been guiding price action for years. The chart shows this rebound happened while price stayed above the $110 support zone—a level that's repeatedly acted as a key floor during recent consolidation.
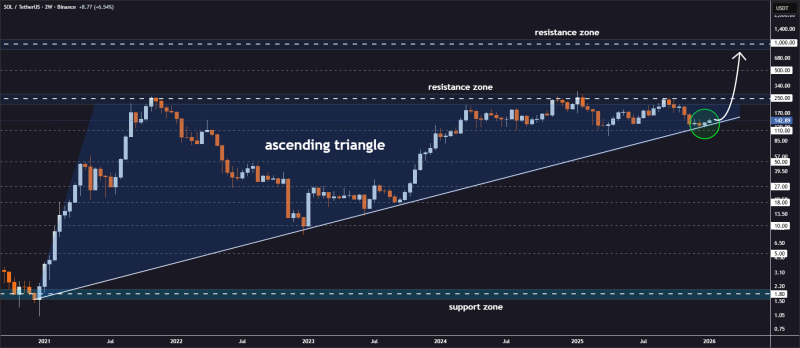
⬤ The ongoing consolidation above $110 suggests selling pressure has stayed contained, allowing Solana to hold higher lows within the broader structure. The ascending triangle formation reflects sustained demand at progressively higher price levels while horizontal resistance remains intact. This price behavior shows SOL continuing to compress between rising support and overhead resistance, indicating breakout preparation is underway rather than a breakdown scenario.
⬤ The chart highlights several clearly defined resistance zones that align with historical price levels. Initial resistance sits near the $250 area, followed by higher zones around $500 and $1,000. These levels represent areas where price previously encountered supply, and they now serve as reference points should a breakout from the ascending triangle occur. The current structure shows SOL maintaining constructive positioning beneath resistance while holding firm above long-term support.
⬤ This technical setup matters for the broader crypto market, as Solana often reflects sentiment across high-cap digital assets. A sustained hold above $110 keeps the ascending triangle intact and preserves potential for expansion toward higher resistance zones. Conversely, failure to maintain this support would weaken the structure and delay upside scenarios. As price continues consolidating within this narrowing range, market participants are closely watching for confirmation of the next directional move.
 Marina Lyubimova