 Peter Smith
⬤ Solana has been bleeding harder than most major cryptos recently, taking out nearly all the downside liquidity that was sitting below. The liquidity heatmap shows how waves of selling through late October and mid-November wiped out multiple support levels, leaving very little liquidity underneath the current price. Most of the weak hands have already been shaken out.
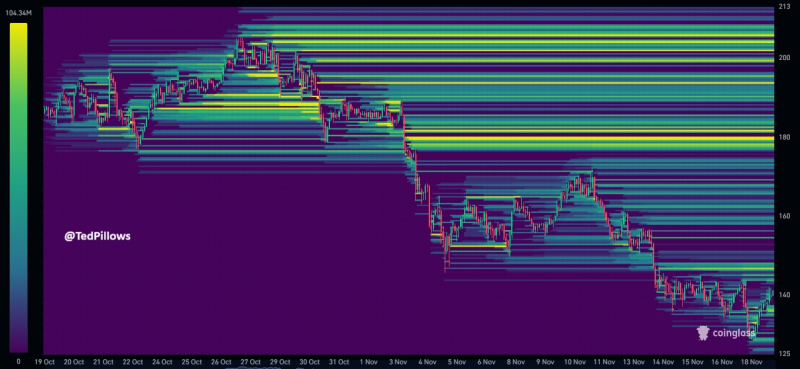
⬤ The heatmap reveals thick liquidity clusters stacked between $170 and $200, shown as bright, high-intensity bands where significant orders are waiting. With most lower liquidity zones already cleared during the selloff, SOL has limited room to drop further in the short term. The token appears to have flushed out its downside targets, setting up a potentially cleaner path upward.
⬤ This shift creates an interesting setup where SOL could rally hard if the broader market catches a bid. Price has been stabilizing around $140, and the overhead liquidity bands offer clear targets if buyers step back in. Even a small improvement in sentiment could pull SOL toward those higher liquidity zones, especially since there's not much left below to absorb selling pressure.
⬤ What makes this notable is how badly Solana has lagged other majors. With big liquidity sitting above the market now, SOL's next move could set the tone for altcoin rotation. If risk appetite returns, those $170-$200 clusters might become magnets for price action, potentially driving how capital flows through the altcoin sector during the next leg up.
 Peter Smith


