 Usman Salis

Shiba Inu (SHIB) just smashed through a crucial technical barrier that's been holding it back for months. With over 100 trillion tokens moving and the price now sitting above $0.0000125, this meme coin is finally showing some serious momentum.
Shiba Inu (SHIB) Price Finally Crushes the 26-Day EMA
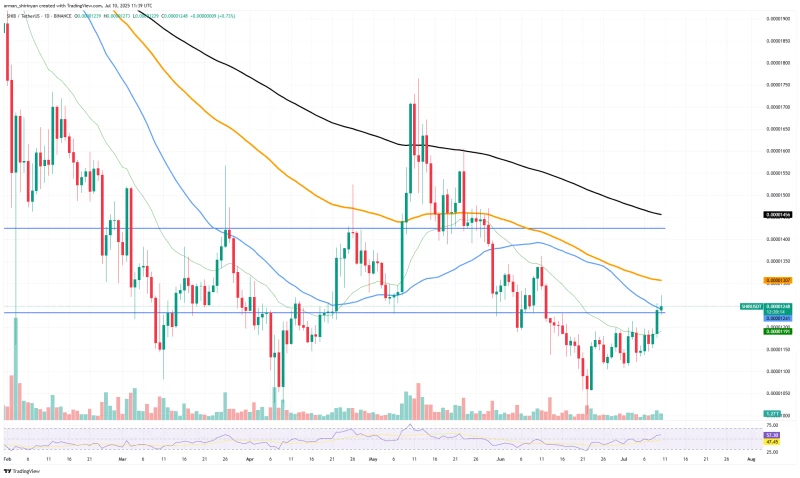
After getting rejected over and over since early June, SHIB has finally broken above the 26-day exponential moving average. This isn't just some random technical line – it's been the main thing stopping any real recovery attempts for months.
What's really interesting is that SHIB is now trading consistently above $0.0000125, which is a pretty big deal for both the charts and investor psychology. The bulls have been doing a solid job defending the $0.0000110-$0.0000112 support zone, creating higher lows that set up this current breakout.
The RSI is sitting around 58 right now, which means there's still plenty of room to run higher before things get overbought. That's actually a good sign if you're looking for more upside.
Massive SHIB Movement Shows Real Interest is Back
Here's where things get really wild – over 100 trillion SHIB tokens have been moved around in the past month alone. That's a massive jump from the dead quiet we saw back in May. This kind of volume usually means the big players are getting active again.
Even better, more than 100 trillion SHIB tokens are now "in the money," meaning people bought them at lower prices than where we're trading now. That's huge because it means less selling pressure from people trying to break even.
The whales and big-money addresses are clearly positioning for more upside. When you see this kind of on-chain activity picking up, it's usually a sign that something bigger is brewing.
Technical Setup Points to More SHIB Price Gains
Looking at the charts, SHIB is now challenging the 50 EMA overhead. If it can push through that, the next real test comes around $0.0000130 where the 100 EMA sits. That could be a tough nut to crack.
But here's the thing – if SHIB can break above $0.0000145 (the last high before everything went south in June), that would be a game-changer. We'd be looking at a potential run toward $0.00002, which would confirm this whole thing is more than just a quick bounce.
The on-chain data backs up what the charts are showing. All this token movement between wallets suggests real accumulation is happening, not just day traders flipping coins. That's the kind of foundation you want to see for a sustained move higher.
Of course, traders should keep an eye on volume and watch for any big dumps hitting exchanges. But right now, the momentum is clearly on the bulls' side.
 Usman Salis


