 Peter Smith

⬤ SEI just hit the bottom of its trading channel and is sitting at a support level that's made a real difference before. The big question now is whether it has enough juice to push back up toward 0.25. Right now, SEI is trading at 0.1357 after touching the channel floor, which sits somewhere between 0.1320 and 0.1400. This is the same area where past drops have stopped and reversed.
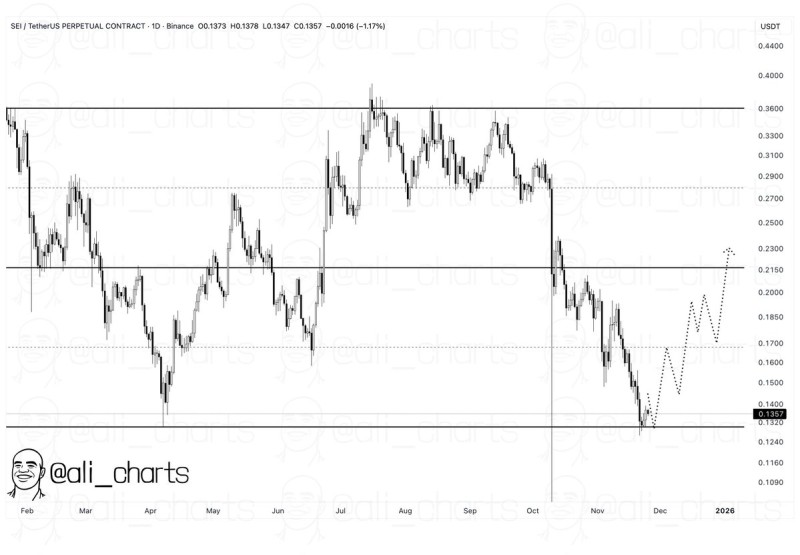
⬤ The daily chart shows a pretty steady drop from the 0.36 area, with SEI breaking through several support levels before landing at the bottom boundary. You can see some lower wicks forming around this zone, which suggests buyers are starting to show up. If SEI manages to climb from here, the next spots to watch are around 0.1850 in the middle range and 0.2150 higher up. Those levels match up with possible recovery paths shown on the chart, but only if SEI starts making higher lows from where it is now.
⬤ The bigger picture shows a wide horizontal channel that's been in play all year, running from the 0.13 floor up to about 0.36 at the top. SEI has bounced between these boundaries multiple times, creating a clear range. The chart shows potential paths back toward the middle of this channel, with a chance of reaching 0.25 if momentum turns around. That matches the upside target being discussed, though there's no confirmed breakout yet.
⬤ This matters because SEI is right at one of the most important technical levels on its long-term chart. If it holds at the channel bottom, it could shift how traders view the token's direction over the next few weeks and decide whether this recent drop turns into sideways movement or sets up a bigger bounce.
 Peter Smith


