 Peter Smith

After weeks of steady losses, SEI has finally punched through its descending resistance—a shift that hasn't gone unnoticed.
Technical Analysis: SEI Confirms Downtrend Breakout
Crypto analyst Crypto Patel believes this breakout could trigger a 50% price jump, with a near-term target around $0.30 if momentum stays strong. The chart shows a clear bullish structure with defined entry and exit points, suggesting SEI might be kicking off a fresh short-term uptrend.
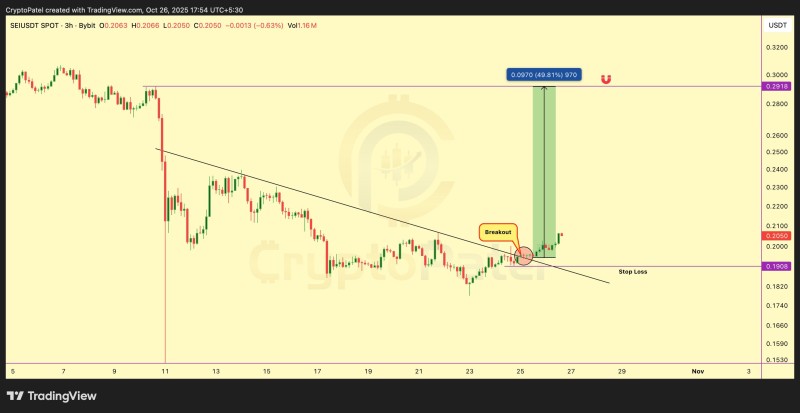
The 3-hour SEI/USDT chart on Bybit displays a textbook breakout after an extended downtrend. Following a series of lower highs, SEI finally broke through its diagonal resistance near $0.205, signaling a potential shift in market direction.
Key technical highlights:
- Confirmed Breakout: SEI pushed above its descending resistance, validating a bullish reversal from recent lows.
- Upside Target: The chart projects a target of $0.2918—roughly a 50% gain from the breakout point, marked by the green measured move.
- Stop-Loss at $0.1908: A clear invalidation level sits below the breakout base. Falling under this would cancel the bullish setup and suggest renewed weakness.
- Short-Term Support Zone: Price is currently consolidating just above $0.20, which now acts as immediate support before any push higher.
If SEI holds above this breakout level and builds volume, traders could see a gradual climb toward $0.25, followed by the key resistance zone around $0.30.
Market Context: Why SEI's Structure Looks Promising
This bullish setup emerges as sentiment improves across mid-cap altcoins following Bitcoin's recent stabilization. Several factors appear to be driving renewed interest in SEI:
Market rotation into faster-moving alts with technical momentum has put SEI on traders' radars. The SEI Network continues gaining ground in the Layer-1 and DeFi space, adding fundamental support to the technical picture. Plus, with a tight stop-loss and solid upside potential, the risk/reward ratio looks attractive for short-term traders.
These elements combine to make SEI's current chart one of the more interesting setups among emerging altcoins this week.
The breakout candle above the trendline came with a noticeable momentum shift. Price action suggests the $0.205–$0.210 range is serving as a retest zone after the breakout, while the next major resistance waits around $0.29–$0.30.
The structure also shows bulls have formed a higher low, breaking the previous pattern of descending peaks—an early signal that the trend might be reversing.
 Peter Smith


