 Saad Ullah

⬤ SEI's price action just shifted gears after grabbing liquidity and breaking its recent downtrend structure on the 4-hour chart. The token dipped into a marked liquidity zone before bouncing back and forming a higher low. Downside liquidity got hit twice, which suggests selling pressure dried up and the short-term structure turned bullish.
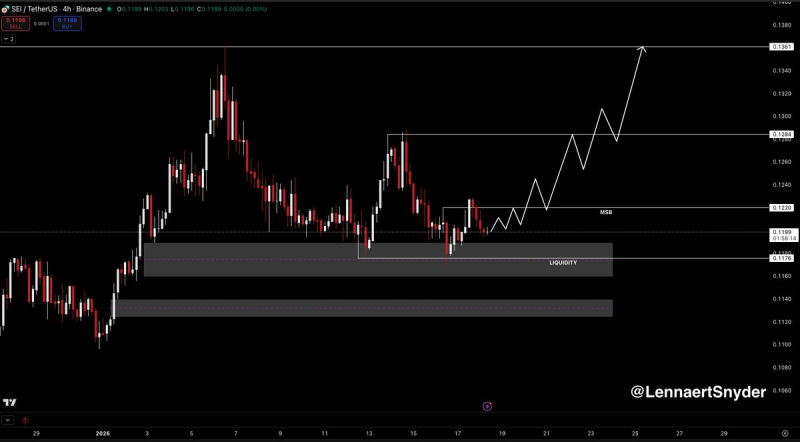
⬤ The $0.1169 level is the line in the sand right now—that's where SEI formed its recent low after the liquidity sweep. As long as price stays above this support, the bullish reversal stays intact. The chart shows higher lows and a clear break above previous consolidation, signaling that buyers are now in control.
⬤ Looking up, SEI faces resistance near $0.122 first, then a stronger barrier around $0.128. If momentum holds, the next target sits at the prior high near $0.136. These levels map out the upside potential based on current structure.
⬤ Liquidity sweeps followed by structure breaks often mark turning points in short-term trends. For SEI, staying above $0.1169 keeps this bullish setup alive. A breakdown below that support would flip the script and bring downside risk back into play. With Bitcoin still driving altcoin sentiment, how SEI reacts around these levels will likely determine its next move.
 Saad Ullah


