Saad Ullah
SEI is showing signs of a major reversal after an extended period of downward pressure. A textbook double-bottom formation has emerged on the long-term chart, suggesting that selling momentum may be exhausted and buyers are returning with confidence. This technical setup, combined with improving market conditions, positions SEI for what could be a significant rally in the months ahead.
Chart Setup and Pattern Recognition
Trader Mister Crypto recently highlighted a well-defined double-bottom on SEI's chart, which has been taking shape after repeated tests of the $0.20–$0.25 support zone. This pattern typically signals a shift from bearish to bullish sentiment, as buyers defend key levels and prepare to push higher.
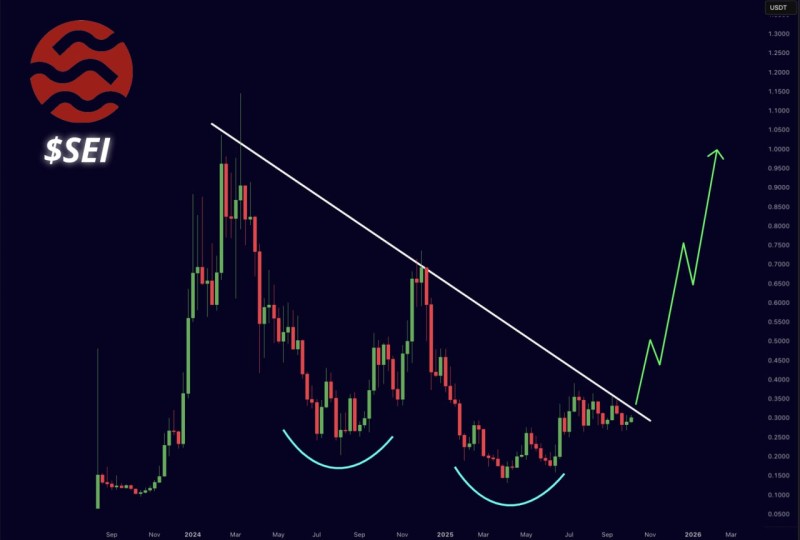
The formation comes after months of consolidation, with SEI grinding along a descending trendline that's acted as resistance since late 2023. Right now, the price is testing that trendline around $0.30. A clean break above this level would validate the pattern and open the path for a stronger move upward.
Key Levels and Targets
The chart reveals a few critical zones worth watching:
- Support at $0.25: This level has held firm through multiple tests over the past year and remains the foundation of the current structure.
- Resistance near $0.35: This aligns with the descending trendline and represents the first major hurdle for bulls to clear.
- Upside target at $1: Based on the double-bottom projection, a sustained breakout could drive SEI toward the $1 mark, representing roughly a 3x gain from current levels.
Why This Setup Matters
The timing of this pattern is notable. Across the broader crypto market, sentiment toward altcoins is shifting, with capital beginning to flow back into higher-risk assets. SEI's technical setup aligns with this change in tone, making it a potential standout in the next phase of the cycle. If volume picks up and the breakout is confirmed, SEI could attract significant attention from both traders and investors looking for asymmetric opportunities.
 Saad Ullah