 Alex Dudov
The SEI market appears to be approaching a critical juncture. Recent technical analysis has identified an hourly chart pattern showing SEI/USDT trading within a descending wedge formation—a classic structure that often marks the exhaustion of a downtrend. The asset is currently consolidating near the lower boundary around $0.18, where previous price action suggests meaningful accumulation support.
A Technical Setup Worth Monitoring
Trader Ali recently highlighted this setup, noting that the chart outlines converging resistance and support trendlines moving downward, alongside Fibonacci retracement levels that mark potential recovery zones. The support zone sits between $0.178 and $0.184, where price has bounced multiple times.
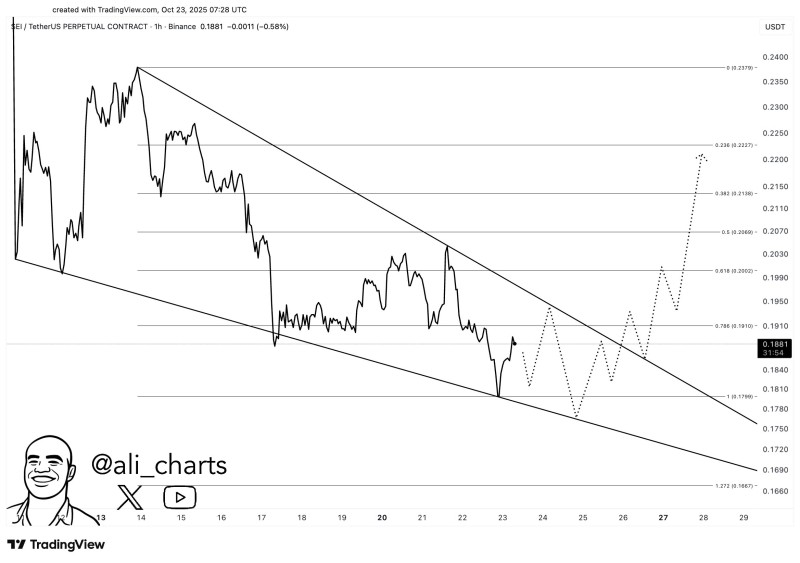
Immediate resistance appears around $0.191, aligning with the 0.786 Fibonacci level. Beyond that, traders are eyeing targets at $0.206 (0.5 Fib), $0.213 (0.382 Fib), and the major technical objective at $0.222. The pattern's tightening shape indicates declining volatility and fading selling pressure, conditions that typically precede reversals when buyers step in. The projected path shows a gradual staircase pattern with higher lows leading toward the upper wedge resistance before potentially breaking above $0.20.
Market Context and What to Watch
SEI has faced headwinds through a series of lower highs since mid-October, reflecting broader caution in the altcoin space. However, as Bitcoin finds its footing near key support levels, confidence is gradually returning to smaller-cap tokens. If SEI maintains ground above $0.18, technical traders see opportunity for a bullish response. A break below could push price toward $0.17, where the 1.272 Fibonacci extension represents a final line of defense before the pattern potentially fails. Volume will be the deciding factor—a breakout with rising participation would confirm fresh upward momentum, while weak volume could mean more sideways action ahead.
 Alex Dudov


