 Saad Ullah

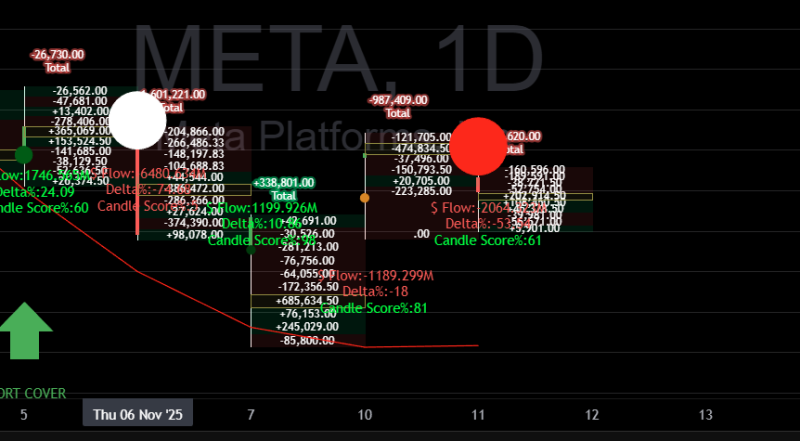
⬤ Recent observations have highlighted strange activity around Meta Platforms, with one trader noting that the buying pattern looks like it's coming from a well-connected, discreet type—someone who doesn't advertise their moves. The flow chart shows clusters of buying and selling activity through bubble sizes and color-coded data, but it's not pointing to any specific price direction. What it does show is moments where buying pressure noticeably picked up—consistent with the idea of someone quietly accumulating shares.
⬤ This is all happening against a backdrop of tax policy debate that's got big tech companies on edge. Proposed changes could tighten capital flexibility, squeeze innovation budgets, and potentially push high-skilled workers toward friendlier tax jurisdictions. That kind of uncertainty makes long-term planning harder and adds another layer of risk across the sector.
⬤ The flow data itself illustrates periods where buying intensified without tipping off the broader market—classic strategic accumulation. This type of behavior usually means someone with size and patience is building a position carefully, trying not to move the needle too much in the process.
⬤ For anyone tracking Meta, this mix of quiet accumulation, regulatory uncertainty, and tax-related risk creates an environment where it pays to stay alert. Unusual buyer activity can signal confidence from bigger players, but the real story depends on how policy shakes out and where sector sentiment lands. Traders will keep watching META's flow patterns to see if this turns into something more sustained in the coming weeks.
 Saad Ullah


