 Saad Ullah

⬤ Ethereum is hovering near $3,081 and continues grinding lower within what appears to be a corrective Elliott Wave structure. The chart shows ETH/USD working through a complex decline that may be close to finishing. The expectation is for a 7-swing pattern to wrap up next week, with buyers likely stepping in somewhere between $2,769 and $1,824—setting up a potential three-wave bounce.
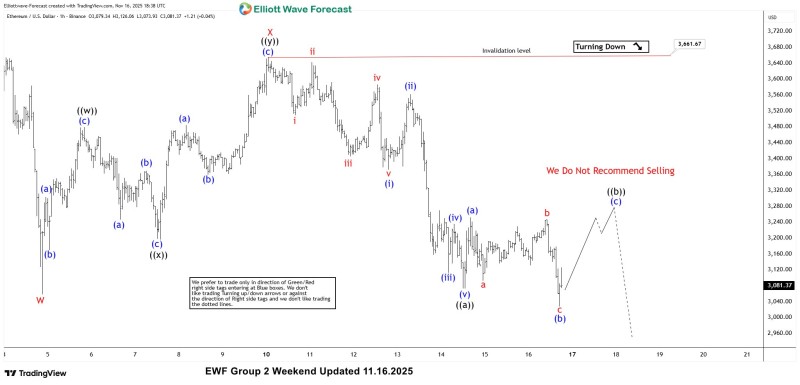
⬤ The wave count includes multiple corrective subdivisions and impulsive labels, with ETH/USD trading well below the invalidation level around $3,661.67. That upper boundary defines the ceiling of this corrective phase. A "Turning Down" marker confirms the downward tilt, but the chart explicitly says "We Do Not Recommend Selling," treating this as a structural correction rather than a major trend shift. The projected path shows a possible short-term rise through wave ((b)) before the next move gets evaluated.
⬤ Visually, ETH looks to be forming a base after completing the latest wave (b) leg in blue. From there, an advance toward the $3,200–$3,280 range is expected before another pullback potentially emerges. The support zone between $2,769 and $1,824 is where this corrective sequence is most likely to finish, making it the key area to watch for a reversal.
⬤ This matters because multi-swing Elliott Wave patterns tend to shape short-term expectations in liquid markets like crypto. When price nears a clear structural endpoint, it often influences sentiment and volatility as the broader cycle plays out. With a maturing 7-swing structure, defined invalidation levels, and a mapped support zone, ETH/USD is at a potentially important inflection point in this corrective phase.
 Saad Ullah


