Usman Salis

Dogecoin (DOGE) has hit a make-or-break moment in its long-term cycle. The meme coin is now sitting right on a major support trendline that's held strong for over a year—and this is the third time it's touched this level. Historically, moments like this either spark a solid rebound or mark the last stop before things fall apart.
DOGE Weekly Chart Highlights 3rd Support Touch
The current cycle mirrors what happened back in 2023–2024, when a similar pattern led to a steady recovery. The chart shows three key touches on the support line in each cycle, with the third touch typically acting as a turning point.
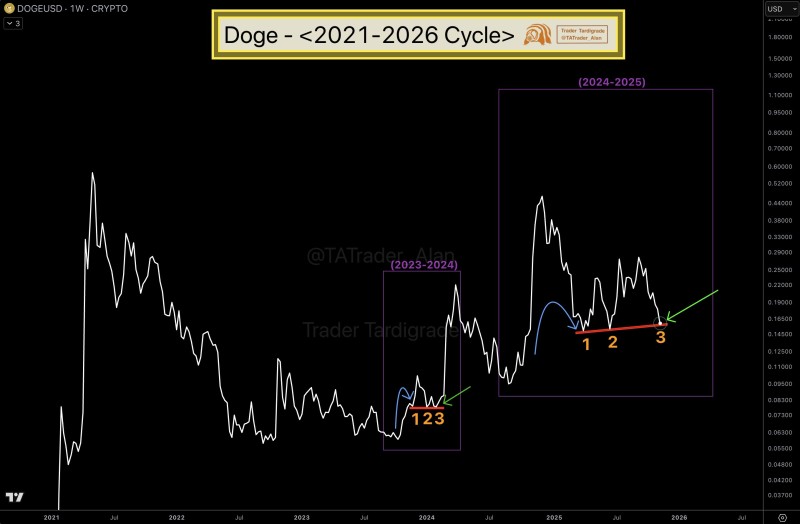
Right now, DOGE is once again resting on that trendline—the same spot that kicked off a multi-month climb in the past. The comparison includes two boxed zones: one from the 2023–2024 recovery period and another projecting a potential bullish window for 2024–2025.
Breaking Down the Technical Setup
The chart reveals a long consolidation phase interrupted by three notable dips, all landing on the same rising support line.
The pattern looks like this:
- Touch 1: Initial bounce off support
- Touch 2: Retest confirms the trend
- Touch 3: Final check, often before a reversal
Both cycles show a green arrow pointing to a potential recovery zone, suggesting another slow bull run might be taking shape.
What's Driving the Setup
Several factors line up with this technical picture:
- DOGE's ongoing integration with the X platform
- Fresh liquidity flowing back into altcoins
- Growing retail interest during Bitcoin's halving cycle
These external catalysts add weight to what the chart is showing.
What Comes Next
If Dogecoin holds this support level, history suggests we could see a gradual climb similar to previous cycles. But if support breaks, any real recovery could be pushed back significantly. The next few weekly closes will be critical.
 Usman Salis