 Marina Lyubimova

⬤ Dogecoin's momentum is showing signs of an important shift as a fresh bullish RSI divergence takes shape on the daily timeframe. The signal has emerged while DOGE trades near local lows, and the chart reveals several past instances where this exact pattern showed up right before significant downtrends ended.
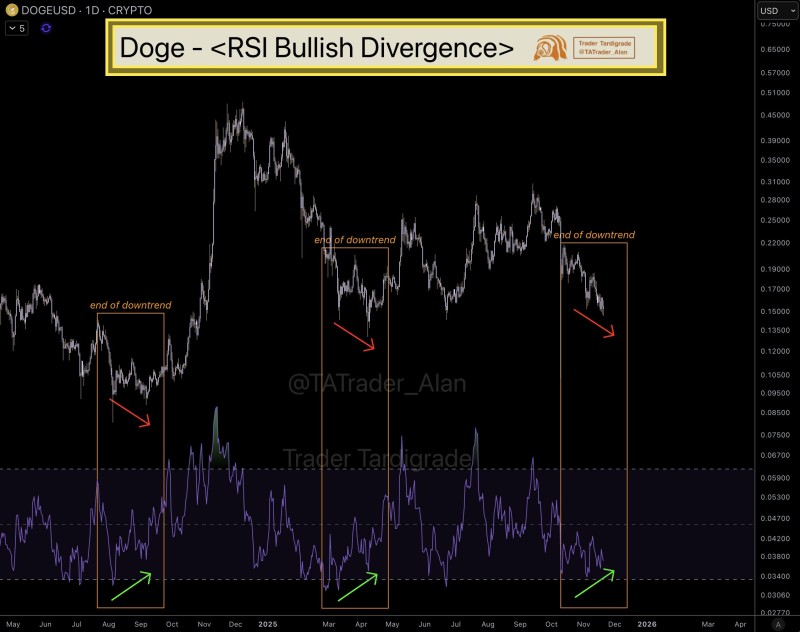
⬤ The setup is straightforward: during each pullback in 2024 and early 2025, Dogecoin's price carved out lower lows while the relative strength index quietly formed higher lows. That's happening again right now. DOGE keeps drifting lower in the $0.13 to $0.15 zone, but the RSI has started climbing. This disconnect hints that selling pressure is fading, even though price hasn't flipped yet. Past occurrences of this pattern led to multi-week recovery runs.
⬤ Three previous "end of downtrend" moments are marked on the chart, each backed by the same RSI behavior. Every time, the divergence flagged weakening bears before Dogecoin kicked into rebound mode. The current signal lines up with that history. While bullish divergence doesn't lock in upside, its track record across multiple cycles makes it worth watching as DOGE potentially nears another turning point.
⬤ Momentum-based reversal signals like this often fire before price catches up, giving early clues about what's brewing under the surface. If this divergence holds, Dogecoin might be sliding into a phase where volatility picks up and sentiment starts to stabilize. The pattern shows how strength can quietly build even while price keeps falling, pointing to a possible structural shift in DOGE's market dynamics.
 Marina Lyubimova


