 Marina Lyubimova
Cardano (ADA) just posted a massive 13% daily jump and 37% monthly gain, now trading around $0.85. With strong technical signals lining up, bulls are eyeing the $1 target despite hitting some resistance.
ADA Price Breaks Out After Weeks of Consolidation
Cardano's having quite the moment right now. After weeks of sideways action, ADA price finally broke free with a sharp 13% rally that's got traders buzzing. The monthly performance is even more impressive - we're talking about a solid 37% gain that's pushed the token from the doldrums back into the spotlight.
Sure, there's some resistance showing up around $0.86, but that's pretty normal after such a strong move. What's really interesting is how the fundamentals are backing up this price action. We're not seeing the usual signs of a pump-and-dump here - this looks like the real deal.
On-Chain Data Shows ADA Holders Aren't Selling
Here's where things get really interesting. The Age Consumed metric - which basically tells us if old-timers are cashing out - is staying super quiet. We saw some major movement back in mid-June when over 130 billion ADA tokens changed hands, but since then? Radio silence, with only about 250 million ADA moving around.
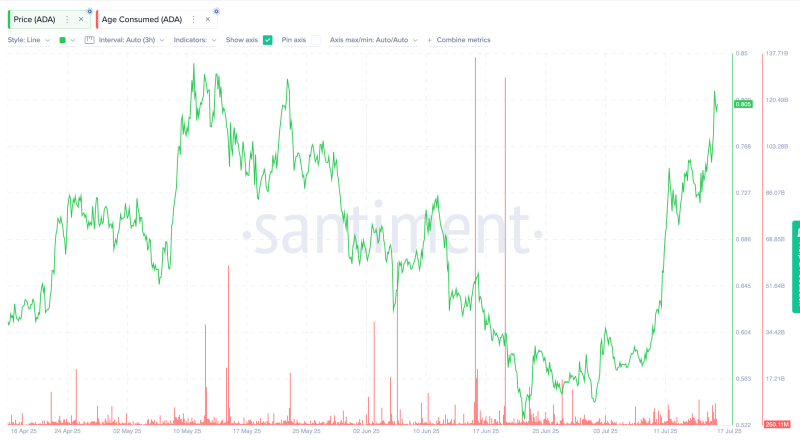
That's actually bullish as hell. When prices are pumping but old coins aren't moving, it means the smart money isn't panicking to sell. These are the folks who've been holding through thick and thin, and they're clearly not worried about this rally being a flash in the pan.
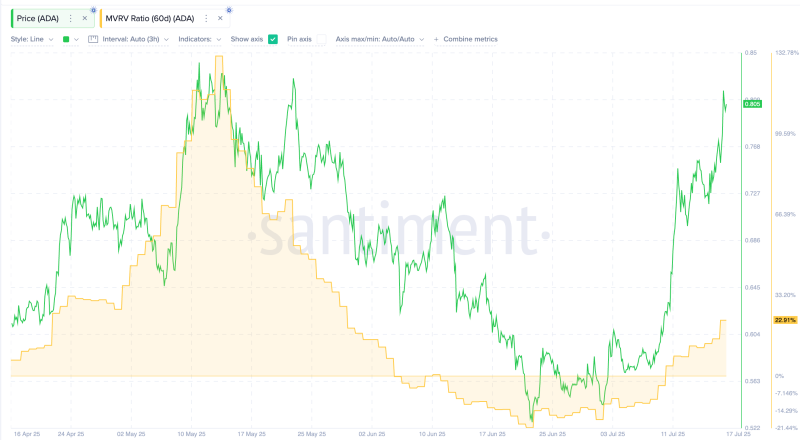
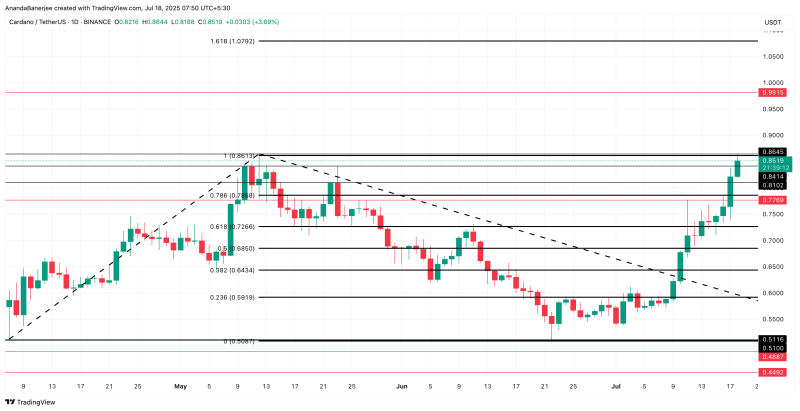
The MVRV ratio is telling a similar story. At 22.91%, it's nowhere near the danger zone we saw in May when it hit 131% right before everything crashed. Back in April, when MVRV was around 20-25%, ADA still managed to pump another 35% from $0.62 to $0.85. So yeah, there's probably more room to run here.
Technical Setup Points to More ADA Upside
Now for the juicy technical stuff. ADA just completed what traders call a "triple golden cross" - basically, the 20-day moving average crossed above the 50-day (July 14), then the 100-day (July 17), and just hours ago it crossed the 200-day. That's about as bullish as it gets in the TA world.
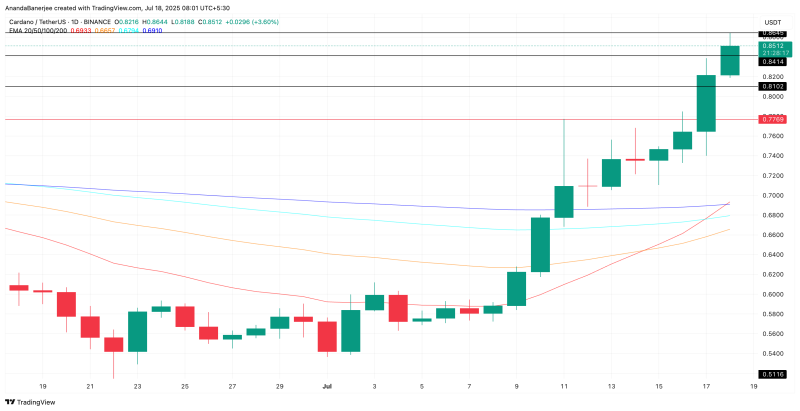
But here's the thing - nothing goes straight up forever. The RSI is showing some bearish divergence on the 4-hour chart. Since July 11, ADA's been making higher highs, but the RSI is actually making lower highs. That usually means the momentum is cooling off a bit, even if prices are still climbing.
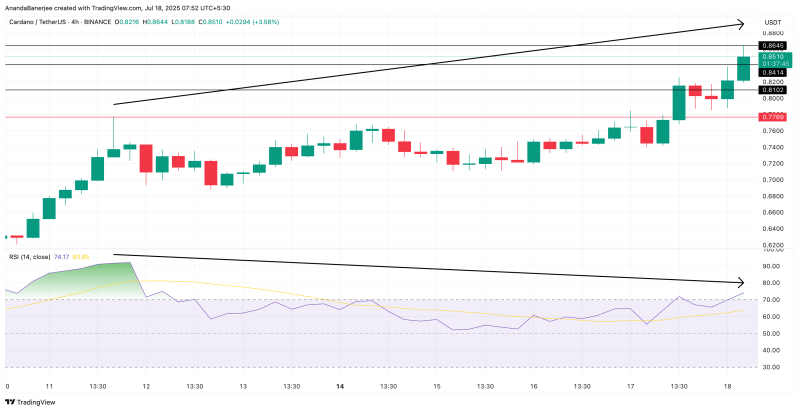
This doesn't mean the party's over, but ADA might need to take a breather before the next leg up. If we do see a pullback, the key level to watch is $0.78. As long as we hold above that, the bulls are still in control.
The next major target? That $1.07 level, which lines up with the 1.618 Fibonacci extension. But honestly, most people are just watching for that psychological $1 barrier. Once ADA breaks through there, things could get really interesting.
Bottom line: the charts, the on-chain data, and the momentum are all pointing in the same direction. Unless something dramatic changes, this ADA rally has legs.
 Marina Lyubimova


