 Peter Smith

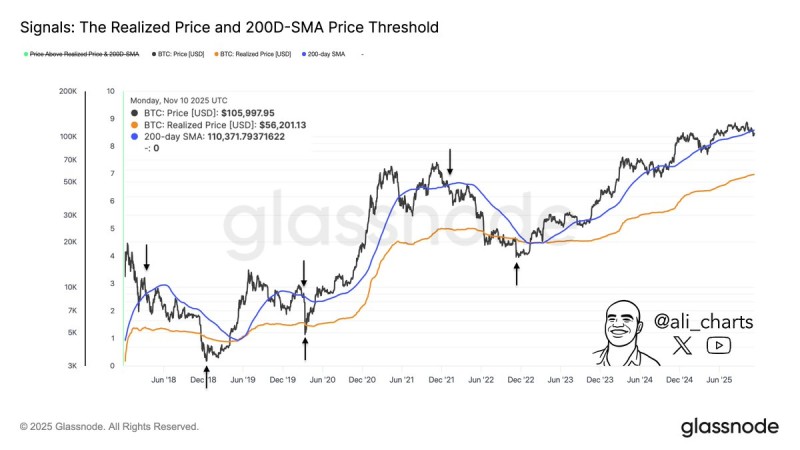
⬤ Bitcoin tends to show weakness when it loses key long-term support levels. Historically, when BTC breaks below the 200-day simple moving average during bear markets, it usually continues falling until it drops under its realized price—currently sitting near $56,200. Past cycles show this pattern playing out repeatedly: a drop below the 200-day SMA is often followed by further declines past the realized price, making these two indicators crucial for spotting periods of serious market stress.
⬤ The risks here are straightforward. When Bitcoin slips below these historically significant thresholds, downside momentum tends to accelerate. This can trigger capitulation among traders, weaken liquidity, and put pressure on leveraged positions—leading to forced liquidations and broader sell-offs. If the pattern repeats, volatility could spike and create a tougher environment for market participants.
⬤ The realized price represents Bitcoin's average cost basis across all holders and often acts as a floor during tough market conditions. Trading below it has historically signaled extended bearish periods before recovery kicks in. Earlier cycles—like late 2018, mid-2020, and 2022—all followed this playbook, offering a useful roadmap for understanding where Bitcoin might be headed now.
⬤ For investors, the relationship between the 200-day SMA and realized price matters because it helps gauge whether Bitcoin is heading into a deeper correction or setting up for long-term accumulation. A break below both levels would raise downside risks and shift sentiment more defensive across crypto. Holding above them would suggest stability. With BTC trading near these sensitive areas, the market is watching closely for the next big move.
 Peter Smith


