 Saad Ullah
XRP (XRP/USDT) is approaching a critical technical inflection point, with price action consolidating just above a compressed EMA ribbon on the 2-day Binance chart. The $2.23 resistance level now serves as the key threshold. A confirmed breakout above this range could validate bullish continuation patterns and unlock significant upside potential in the near term.
XRP Price Eyes Breakout Above Key EMA Ribbon
In a recent post on X, popular trader Steph Is Crypto spotlighted what he calls “the most important chart to watch now for XRP.” The chart, shared from Binance’s 2-day time frame, shows XRP consolidating tightly around the $2.23 level, resting directly above a stacked EMA ribbon.
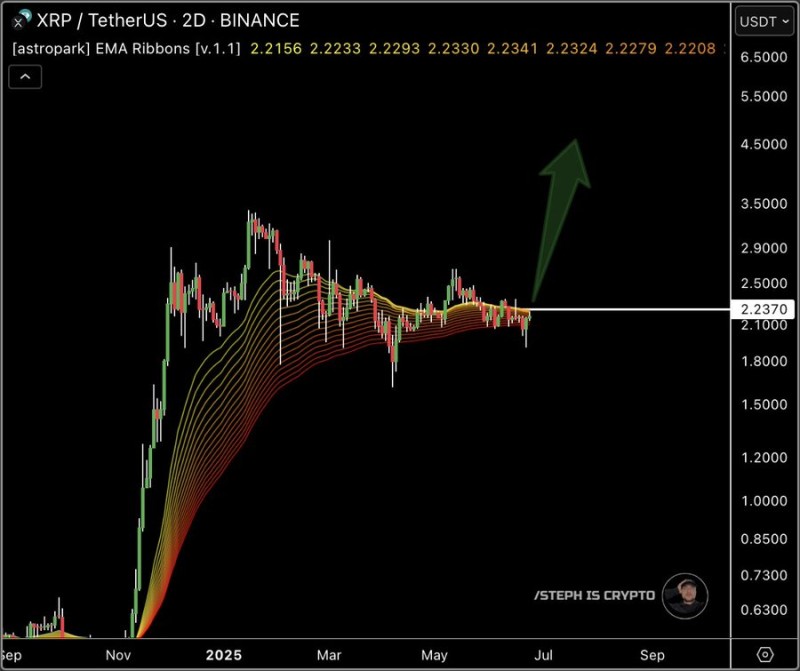
This ribbon, often interpreted as a zone of dynamic support and compression, reflects a technical squeeze that may lead to a significant price expansion. Currently, XRP trades at approximately $2.2370, with EMA levels ranging from $2.2156 to $2.2341 — indicating growing pressure near the resistance zone.
Why This Level Matters for XRP (XRP/USDT)
According to the X post, a clean break above this horizontal level could open the door to much higher price targets. Historically, such technical patterns — where price consolidates just above a strong support ribbon — have led to sharp upward moves, especially when accompanied by volume spikes.
With the broader market showing signs of strength and XRP holding above $2.20, bulls are watching closely. The chart suggests that any breakout from this range could push XRP toward $2.50, $2.90, or even higher in the short term.
 Saad Ullah


