 Saad Ullah

● Tolkunflex shared an ADA/USDT chart analysis on TradingView, pointing out a make-or-break moment for Cardano's near-term price action. With ADA hovering around $0.6695, it's testing a horizontal support that's held firm multiple times on the 4-hour chart. The trader made it clear: "If a 4H close occurs below the black line, I'll open a short position."
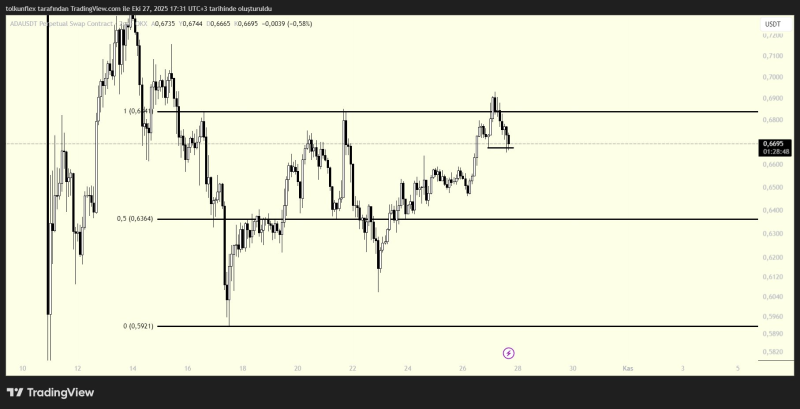
● The plan is simple but strategic — only short if ADA closes beneath that key black line. This zone has been acting as support after a bounce from the $0.6364 Fibonacci level. A clean break below could open the door to more selling pressure and volatility, potentially pushing ADA toward the next support around $0.636–$0.64.
● If buyers step in and hold the line, ADA might bounce back toward $0.674–$0.68, keeping the bullish structure intact. But if that support fails and the candle closes below, short sellers could pile in, driving the price down toward the $0.5921 Fibonacci level shown on the chart. It's a clear technical fork in the road — wait for confirmation or act fast if the trigger hits.
● This setup reflects a broader shift in the altcoin market, where many coins are testing mid-range supports after recent rallies. Whether Cardano holds or breaks this level could determine if the uptrend continues or if a correction is coming.
 Saad Ullah


