 Saad Ullah

⬤ Gold is trading just below a critical resistance band at $4,435 to $4,440, where sellers have started pushing back. The metal sits at a make-or-break technical level after recovering from recent losses, and how it behaves here could set the tone for what happens next. The US session will be crucial in determining whether gold can push through this ceiling or gets rejected once again.
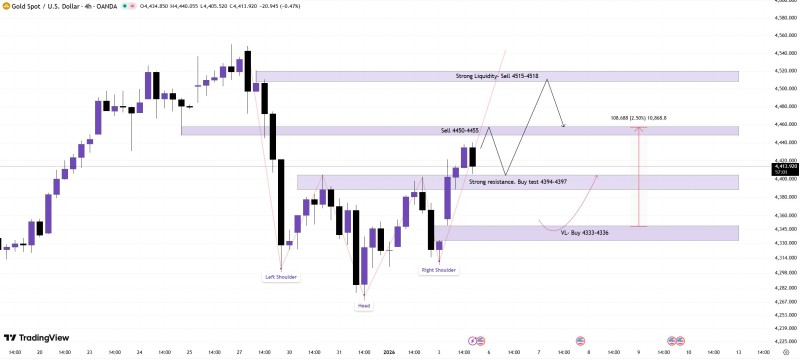
⬤ If gold slips below $4,410-$4,405, buyers might step in at lower levels between $4,360 and $4,390. There's also a deeper support zone marked around $4,333-$4,336 that lines up with previous buying interest after a sharp drop. These areas represent spots where gold has been actively bought on dips before, making them logical places to watch if prices pull back during today's trading.
⬤ On the flip side, if gold can't break cleanly through $4,450-$4,460, short sellers might see an opportunity. Additional supply zones sit near $4,450-$4,455 and higher up at $4,515-$4,518, where selling pressure emerged before. The chart shows possible paths for both scenarios—either a bounce off resistance leading to retracement, or momentum stalling at these key levels and reversing lower.
⬤ Gold remains one of the most-watched safe haven assets globally, and these technical levels often drive short-term trading decisions. With clear boundaries drawn above and below current prices, market participants are focused on how gold handles the $4,435-$4,460 zone. The reaction here could shape sentiment across precious metals markets as the trading day unfolds.
 Saad Ullah


