Peter Smith
⬤ Zeta Global Holdings Corp. shares are taking a breather after an impressive run-up, with the stock now showing clear signs of consolidation. Trading under ticker ZETA, the shares climbed aggressively in recent weeks before hitting resistance and pulling back. The rally that pushed the stock higher is now losing steam, evident in both price movement and technical readings on the daily chart.
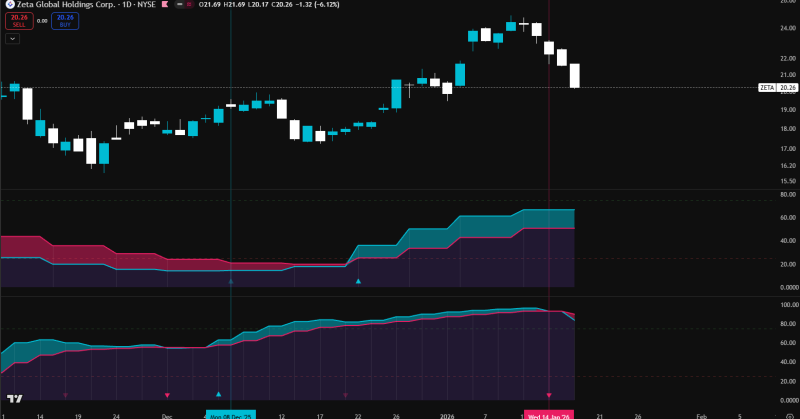
⬤ The chart reveals ZETA's climb from around $16 to the $24–$25 zone—a roughly 30% gain compressed into a short timeframe. Strong bullish candles dominated the advance, showing solid buying pressure throughout. But the picture has shifted recently, with consecutive red days dragging price back toward $20. The latest session closed near $20.26 after a single-day drop of just over 6%, marking a clear pause after the vertical move.
⬤ Technical indicators support the cooling narrative rather than suggesting a full reversal. The fast stochastic has begun crossing lower from elevated territory—a typical sign that upward momentum is fading after an extended push. The lower oscillator panel shows similar behavior, with readings rolling over from the upper zone. These patterns usually accompany consolidation phases where the market digests recent gains.
⬤ This cooling period matters because sharp rallies followed by pullbacks often reset short-term conditions and create healthier trading setups. Pullbacks can shake out excess enthusiasm and establish more stable price zones. How ZETA behaves from here will likely shape near-term trader sentiment and determine whether the stock finds support around current levels or enters a new directional phase after working off the recent gains.
 Peter Smith