 Alex Dudov
⬤ Zeta Global Holdings (ZETA) is hanging tight near the upper end of its recent range after a solid multi-month climb. The daily chart shows the stock trading around $23.50 after shaking off some earlier dips, holding steady above key support zones.
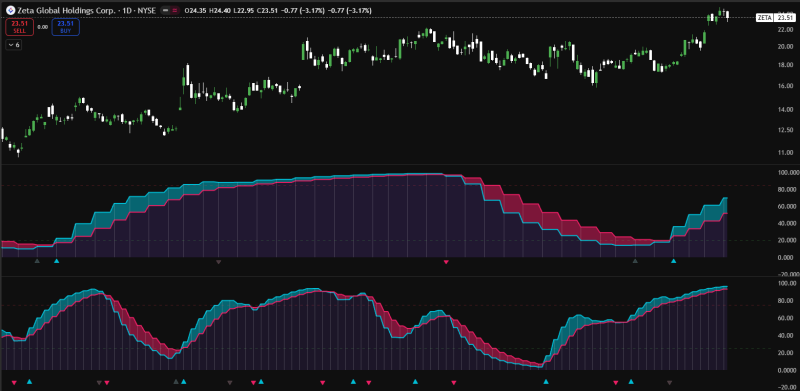
⬤ The chart highlights the slow stochastic indicator, which has been pretty reliable for catching ZETA's bigger moves. During the last bullish run, a confirmed stochastic crossover kicked off a rally that pushed the stock from roughly $12.50 all the way to $22. That move came with building momentum and strong trend strength. Right now, both stochastic indicators are still in their pink phase, meaning we haven't seen full bullish confirmation yet.
⬤ The price action tells an interesting story too. ZETA built a series of higher lows after pulling back toward $18—a level that lit up as a buying zone when multiple bullish triangle patterns showed up. Since then, the stock's been grinding higher and eventually tagged the low $23s. What matters here is that the indicators aren't flashing any confirmed sell signal, which suggests the uptrend is still alive rather than rolling over.
⬤ This setup carries weight because ZETA's previous momentum shifts have led to some serious directional moves once confirmation hit. While we're not seeing the same stochastic crossover that preceded the last major rally, the fact that price is holding firm near recent highs points to underlying strength. How momentum plays out from here will determine whether ZETA keeps pushing higher or settles into consolidation before its next move.
 Alex Dudov


