 Usman Salis
⬤ Zeta Global Holdings is back testing a major resistance level it broke through earlier this year. After a strong rally that pushed shares into the high $30s, ZETA has pulled back and is now stabilizing around the mid-to-high teens—the same zone that kept the stock capped before the breakout. This retest is showing up on the weekly chart as the price holds firm near what used to be resistance.
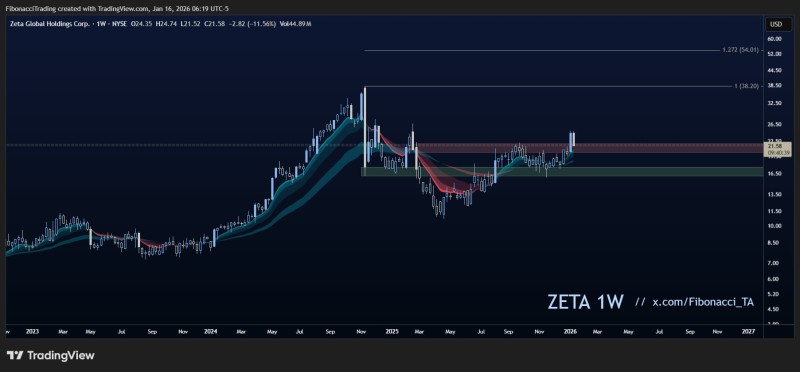
⬤ The weekly chart shows ZETA made a big move in 2024, climbing sharply from lower levels before topping out near $38. Since then, the stock has given back some ground and drifted back toward that old resistance area. Recent candles suggest the pullback is stabilizing rather than accelerating, with price holding above the reclaimed zone while interacting with key moving averages.
⬤ What matters here is whether ZETA can hold above this level. If the stock stays above the mid-to-high teens, it confirms the breakout and keeps the bigger uptrend intact. If it slips below, the technical setup weakens and the earlier rally loses credibility. For now, the chart shows a pause, not a breakdown—and that keeps the structure healthy for the next leg higher.
 Usman Salis


