 Usman Salis

Google's stock has been turning heads lately with a powerful rally that's got traders watching closely. After punching through the important $207.94 level, shares have climbed past $240 and are holding steady. This breakout suggests buyers are stepping in with confidence, and there's potential for more upside if the momentum holds.
Market Watcher's Perspective
In a recent tweet, market watcher Rhino highlighted this bullish setup, drawing attention to the strong lower timeframe structure that's keeping the momentum alive. The technical breakout has caught the eye of traders looking for continuation patterns in big tech names.
What the Chart Shows
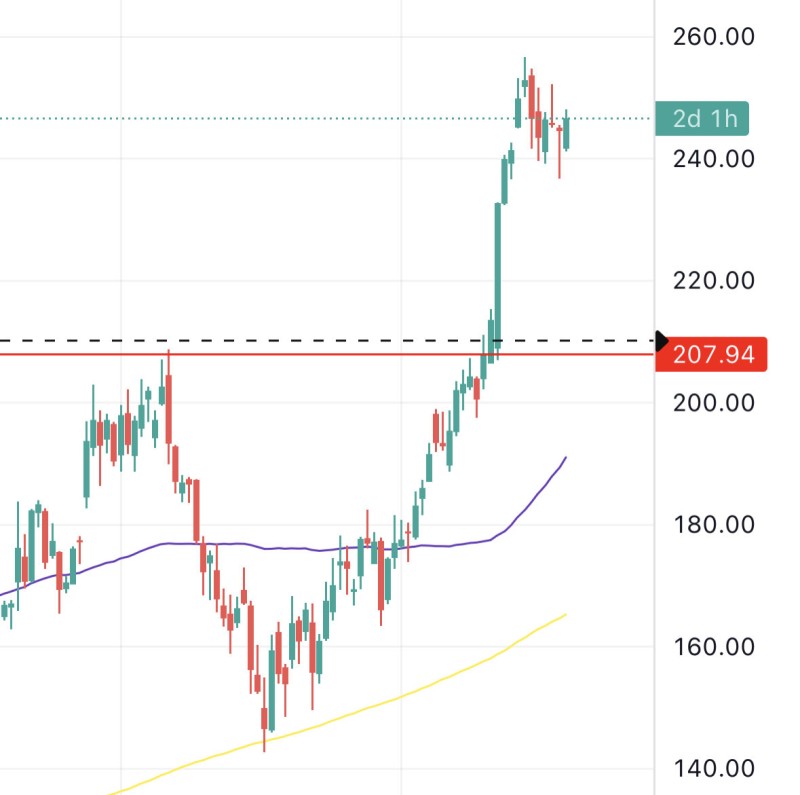
The chart reveals $GOOG trading comfortably above $240 after clearing the $207.94 resistance—a level that had kept the stock capped for months. Here's what stands out:
- Support zone: $207.94 has now flipped from resistance to support
- Recent rally: A sharp move from around $180 to over $240 shows strong buying pressure
- Moving averages: Both the 50-day (purple) and 200-day (yellow) lines are pointing up, confirming the longer-term bullish trend
- Consolidation phase: After touching near $260, the stock is taking a breather—a normal pullback after such a strong run
The price action lines up with the bullish lower timeframe structure mentioned in market chatter, showing buyers are still in the driver's seat despite the recent gains.
Google's push into AI and cloud services keeps getting stronger, while advertising revenue—the company's bread and butter—continues to perform well even with broader economic uncertainty. Plus, when markets turn bullish, big tech names like Google tend to attract heavy institutional buying, which adds fuel to the rally.
 Usman Salis


