Ryan Detrick, a market analyst, a chief market strategist, and a Senior Vice President of LPL Financial, shares his thoughts on the pattern in the US market.
SPX Bullish Pattern Detected
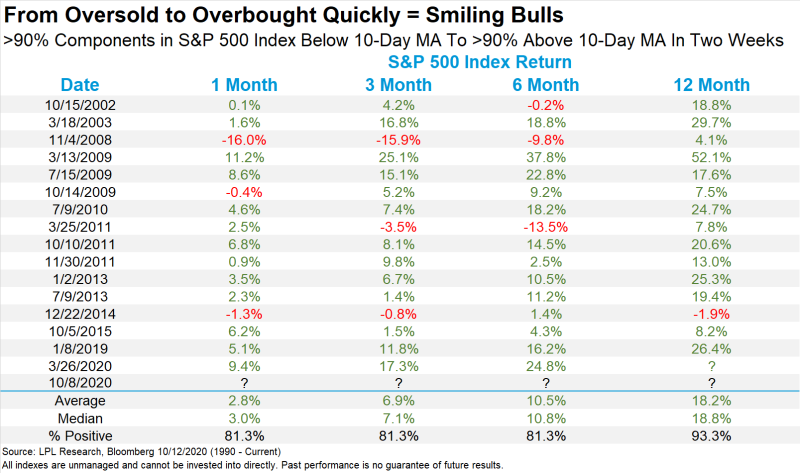
He notes that in just 2 weeks more than 90% of the shares of the largest companies included in the S&P 500 index, turned out to be above the 10-day moving average line, although before that they were all below it. Mr. Detrick notes that this is one of the fastest market transitions from oversold to overbought.
However, the most important thing for the market is not how rare such cases are, but the fact there is a very strong bullish signal, according to historical data. In previous years of observation, in 14 cases out of 15, the S&P 500 showed incredible growth in a year, an average of 18%, the analyst notes.
So more than 90% of the stocks in the S&P 500 were beneath their 10-day MA, then two weeks later more than 90% were above it. This type of oversold to overbought swing is quite rare but is very bullish. Higher one year later 14 out of 15 times and up more than 18% on avg. Ryan Detrick via Twitter

Moving Average is a very popular technical indicator among investors. The 10-day moving average is calculated as the average asset value over the last 10 sessions. Using this indicator allows you to clear the trend from random short-term fluctuations up and down from the main trend movement. If the asset chart crosses its moving average line from the bottom up, it shows the bullish mood of the market.
S&P 500 Q4 Perspectives Are Bright
Earlier, Mr. Detrick noted that the fourth quarter of 2020, according to historical data, should show a yield above 7%, based on a powerful third quarter, which is usually quite weak. Besides, for the 4th year of the presidential cycle, the last quarter is also doing better than usual for the S&P 500.

 Usman Salis

 Usman Salis


