S&P 500 Bullish Pattern Detected bu Analyst
Adam Mancini, the seasoned trader and analyst, shares his thoughts on the S&P 500 this week.
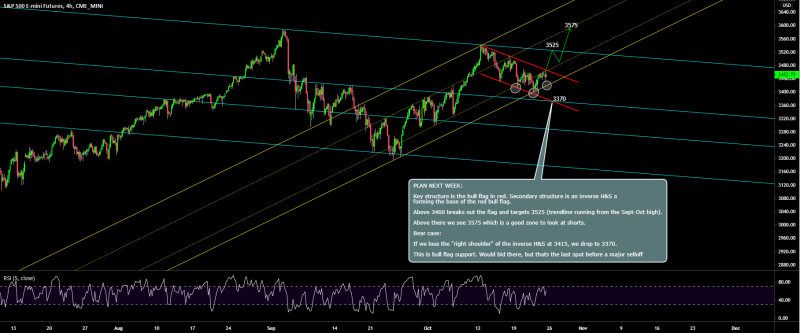
This index includes the 500 largest companies by capitalization, whose shares are traded on the US market. According to Mr. Mancini, there is a fairly high probability of a short-term bearish trend reversal in favor of growth, since an inverse head and shoulders pattern is forming in the market, which may end with a bullish flag at 3525 (this is the resistance line of the long-term descending channel).
Have a great weekend! Election nearing and $spx spent this month setting up for a move that looks to be up Plan next week: The pattern is an inverse H&S within a bull flag. 3465 breaks it out targeting 3520 & 3575. For bears: Loss of 3420 1st sees 3370-last chance spot for longs Adam Mancini via Twitter

Then the growth may continue up to 3575 if the upper border of the channel is broken by the efforts of the bulls.
Nevertheless, Mr. Mancini does not forget about the likelihood of a fall, which fits into the current downward pattern. If the bulls fail to take over the market, the S&P 500 is expected to continue falling to 3370. The analyst notes that this will be the last resistance before the massive selloff.
Any Selling in S&P 500 Might Cause Massive Correction
This opinion echoes the analysis by another expert, @MacroCharts, which he published a few weeks ago. He noted that there was a significant gap in the S&P 500 because the index itself has long overcome the March crisis and rushed to all-time highs, while about 40% of stocks in the index are still trading at prices less than 52-week highs.

According to the analyst, such a gap threatens that any serious sale in the market could lead to a strong correction in the entire S&P 500 index.
 Usman Salis

 Usman Salis


