 Marina Lyubimova
⬤ XRP has been stuck inside a descending channel on the weekly timeframe for months now, showing a slow grind lower with lower highs and lower lows. The price is currently holding steady near a major support zone, which means sellers aren't pushing as hard anymore. This type of pattern usually leads to a big move once it finally breaks one way or the other.
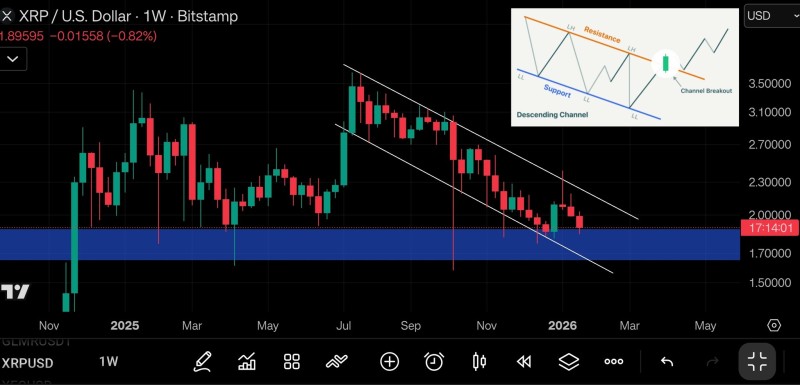
⬤ The chart shows a textbook descending channel where price has been bouncing between resistance at the top and support at the bottom. Even though the slope looks bearish, these formations often flip bullish when price gets squeezed toward the lower boundary. "This setup carries an estimated 60 percent probability of a bullish breakout, based on historical behavior of similar patterns."
⬤ Recent weeks show XRP hanging around the $1.70 to $1.90 demand zone, which has soaked up selling pressure multiple times. Price is still below the top resistance line, but downside momentum looks weak and the range is getting tighter. A weekly close above the channel's upper boundary would confirm the breakout and signal a real shift in momentum.
⬤ Why this matters: weekly chart patterns like this tend to control price action for months. XRP is getting close to decision time as the channel narrows, meaning buyers and sellers are about to pick a direction. Whether it breaks out or stays stuck, how this resolves will likely shape volatility and sentiment across the market in the coming weeks.
 Marina Lyubimova


