 Saad Ullah
Crypto eyes are once again on XRP, as chart watchers draw striking comparisons between today’s setup and the explosive rally of 2017. XRP is showing clear signs of accumulation — a pattern that historically precedes massive upside moves.
A Familiar Pattern Emerging
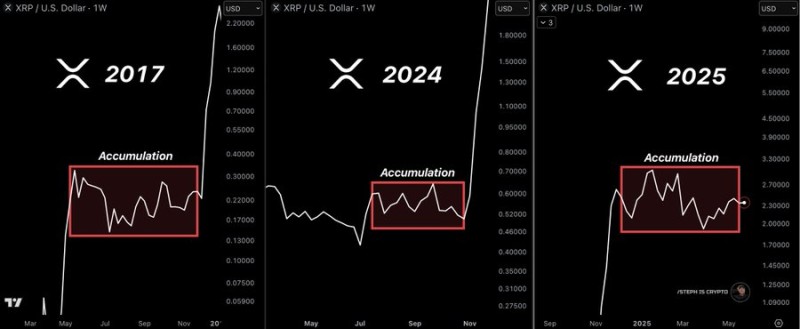
Looking at the historical weekly charts for XRP from 2017, 2024, and now 2025, a repeating pattern stands out. In each of these cycles, the price enters a sideways accumulation phase before surging to new highs. In 2017, that led to a jump to $2.20. The 2024 structure mirrors the same logic, and now 2025 seems to be following suit.
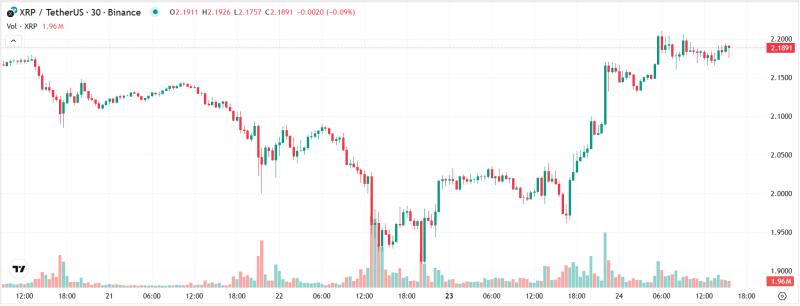
As of now, XRP is trading at $2.1891, with recent price action reaching a high of $2.1926 and a low of $2.1757. Volume remains strong, clocking in at 1.96M, supporting the case for a sustained move.
Why Traders Are Watching Closely
What’s fueling this optimism isn’t just technical history — it’s also timing. With Fed Chair Jerome Powell hinting at potential rate cuts in the near future, markets are preparing for a more risk-on environment. According to @Steph_iscrypto, "XRP will bounce hard. It’s just a matter of time."
If the breakout does occur, XRP could easily revisit and exceed the $3 level seen in previous bull runs. The alignment of macro sentiment, price structure, and historical context is giving traders plenty of reason to stay bullish.
Conclusion
Whether history repeats or simply rhymes, XRP’s current consolidation phase looks increasingly similar to patterns that preceded massive price explosions. If momentum builds, the next leg up might not just be a bounce — it could be a launch.
 Saad Ullah


