 Usman Salis

⬤ SEI has caught traders' attention recently as its weekly chart started showing what looks like a classic bullish recovery pattern. The SEI/USDT pair is demonstrating price behavior that suggests the beginning of a potential trend reversal after months of correction and weakness.
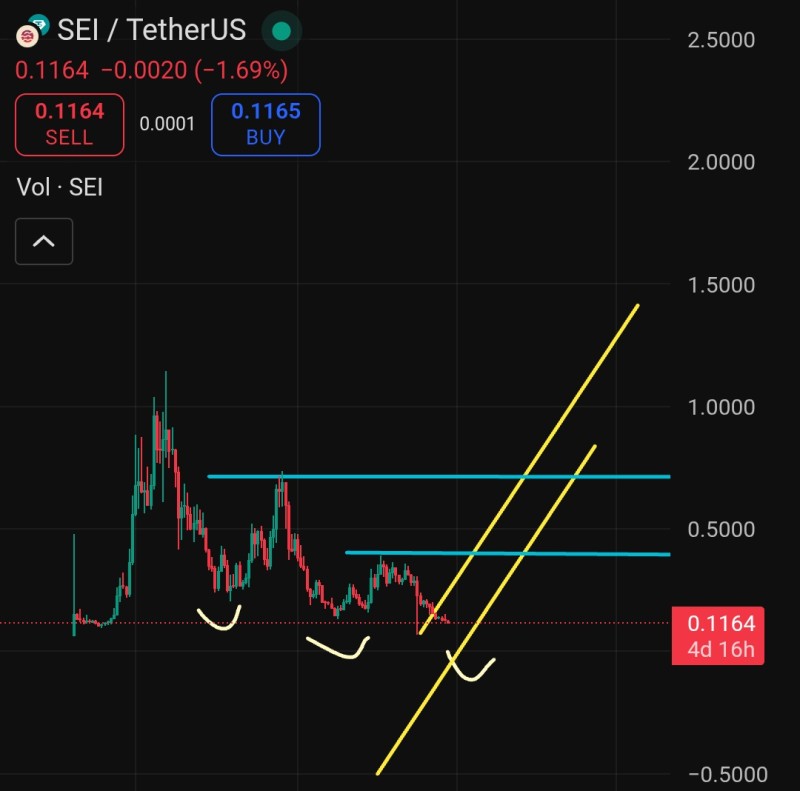
⬤ Right now, SEI is trading around the $0.11 mark following a significant drop from its previous cycle peaks. The price action is forming what appears to be a rounded bottom with higher lows, which typically signals that selling pressure is easing up. The chart shows the price bouncing repeatedly from similar support levels, indicating buyers are stepping in at these lower prices. There are two key resistance zones marked above the current price where previous rallies ran into selling walls.
⬤ An ascending channel drawn from the recent lows outlines a possible recovery trajectory, though it's important to note this isn't a confirmed breakout yet. While the price hasn't reclaimed those overhead resistance zones, the structure definitely looks healthier compared to the earlier downtrend. The analysis positions SEI as a potentially strong performer in the tokenization space, focusing on early-stage positioning rather than making bold price predictions.
⬤ This technical development matters because recovery patterns on weekly timeframes often influence how traders feel about smaller-cap digital assets overall. If SEI can maintain its support levels and keep building those higher lows, it could impact short-term volatility and boost confidence across the broader altcoin market. As the market figures out which assets can shake off long corrections and transition into sustainable uptrends, setups like this highlight how important weekly chart structures are for gauging trend stability.
 Usman Salis


