 Victoria Bazir

Cardano (ADA) is displaying a familiar chart pattern that's grabbed traders' attention lately. The asset has been moving in a repeating cycle - sharp drops followed by solid recoveries that often lead to bigger upward moves.
Repeated Formation Suggests Strong Upside
The chart shows ADA forming nearly identical patterns over recent months. According to trader Sssebi, each cycle starts with a steep sell-off, then bounces back, followed by a smaller dip that sets up a stronger rally.
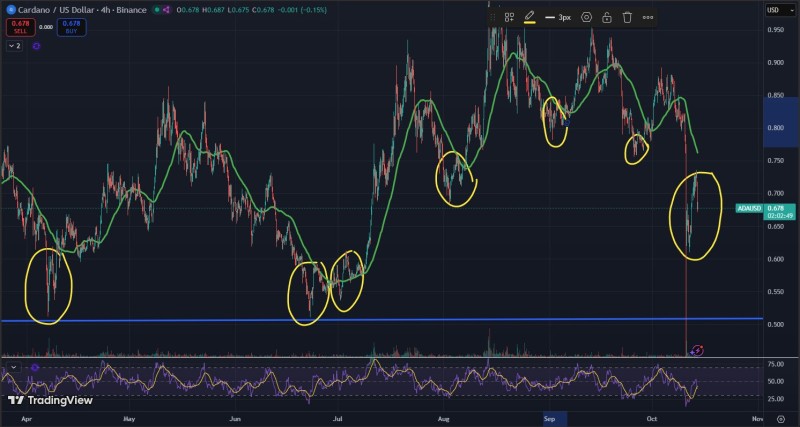
This structure is forming again, and if history plays out the same way, ADA might test $0.80 this week.
Technical Signals Align
Looking at the technicals, several factors are lining up:
- Support Zone: The $0.65 area has repeatedly worked as a bounce point, pulling in solid buying interest
- Resistance Target: The next major hurdle sits near $0.80, which could act as a short-term magnet if bulls keep pushing
- RSI Momentum: The relative strength index is climbing out of oversold territory, hinting at more room to run
- Moving Averages: Price action stays choppy around the green moving average line, though recent bounces have pushed ADA back above it after those sharp drops
Market Context
This repeating pattern reflects how the market's been behaving - aggressive selling gets quickly met with strong buying. Cardano's ability to bounce back consistently shows there's real demand, especially when prices dip lower. While Bitcoin's moves and broader macro conditions still matter, ADA's technical setup keeps drawing speculative eyes.
 Victoria Bazir


