Saad Ullah

Bitcoin is approaching a decisive technical point, with price compressing beneath a descending trendline while testing the $74,500 zone. The setup points to a simple binary outcome: a break and reclaim of that level together with the macro trendline would support a reversal call, while rejection would reinforce weakness and increase the risk of fresh lows.
The BTC Breakdown That Reshaped Weekly Structure
As DonaX₿τ noted, Bitcoin's weekly chart is reading clearly - with the market reacting around a descending macro trendline and the $74,500 level simultaneously.
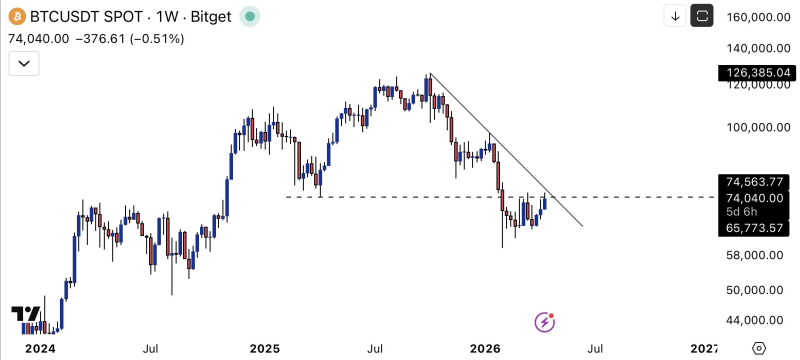
After topping in the $120,000 area, BTC rolled into a sequence of lower highs, with the descending trendline acting as dynamic resistance. Price then broke below the horizontal zone around $74,500 and is now attempting to push back into it from underneath - which makes this area the central battleground on the weekly timeframe.
One BTC Reclaim Could Change the Weekly Tone
What matters here is not just the horizontal level but the confluence. Bitcoin is testing a former support zone while running into the descending trendline at nearly the same point - and that overlap is what gives the setup its clarity.
If buyers manage to break above and reclaim $74,500 while also invalidating the trendline resistance, the weekly structure would begin to shift away from the current bearish sequence. Until that happens, the move off the recent lows still looks like a rebound inside a damaged structure rather than a confirmed reversal.
BTC Pullback Tests Major Weekly Bitcoin Support Zone captured the structural importance of this zone when price was approaching it from above - providing the before-and-after context that makes the current test from below more significant as a potential trend-defining moment.
Rejection Would Keep BTC Weekly Trend Under Pressure
The opposite scenario is just as clear. A rejection from this zone would signal ongoing weakness and keep the lower-high pattern intact - in which case the chart would continue to lean toward another move down and the possibility of new lows.
BTC Tests $72K Resistance 3 Times as Range Breakout Pressure Builds shows how the $72K level has been functioning as a stepping stone in the recovery attempt, with each successful hold adding structural credibility to the push toward the more important $74,500 zone now being tested. Bitcoin Tests $70K Range: $66K Support Comes Into Focus outlines the downside scenario clearly - showing where price would likely head next if the $74,500 rejection plays out and the weekly bearish structure reasserts itself.
The reaction around $74,500 should define the next major directional signal on Bitcoin's weekly chart. The setup is clean, the confluence is real, and the outcome from this level will determine whether the recent bounce was the beginning of something or just another lower high.
 Saad Ullah