Usman Salis

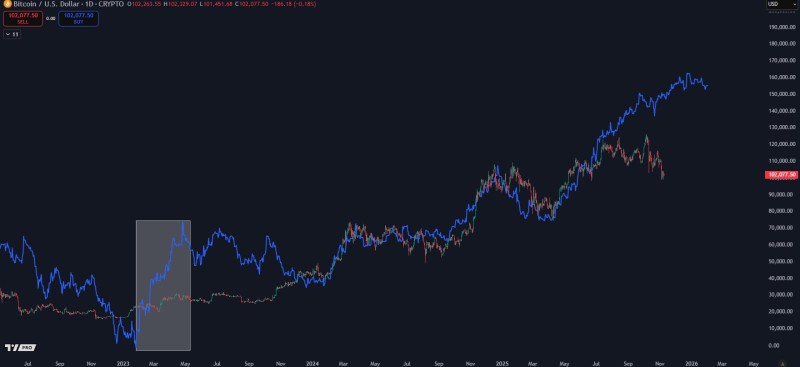
⬤ A recent chart analysis points to a potential shift in the long-tracked relationship between Bitcoin and M2 money supply. This isn't the first time we've seen this disconnect. Back in early 2023, M2 shot upward while Bitcoin just traded sideways, offering a clear example of how the correlation can temporarily break down.
⬤ The regulatory picture adds another wrinkle. Proposed tax changes on digital assets and tighter compliance rules are raising concerns about operational strain on crypto businesses. These pressures could push talent to friendlier jurisdictions or even threaten some companies' survival. That evolving regulatory backdrop makes it harder to read traditional macro signals—especially when investors are trying to use liquidity indicators like M2 as guideposts.
⬤ The chart shows Bitcoin's price action and the M2 line visually splitting apart once again. While there's no prediction being made about where BTC heads next, the observation is straightforward: even when macro liquidity shifts, Bitcoin doesn't always move in lockstep. The 2023 example on the chart backs this up—BTC held steady in a range despite a clear M2 move.
⬤ For traders, this matters because liquidity cycles have long been viewed as key drivers of crypto price action. If Bitcoin keeps drifting away from these patterns, investors may need to rethink how they read macro signals and manage risk. Whether this divergence is temporary or signals a deeper structural shift is still up for debate—but it's becoming clear that the old correlation playbook might need an update as Bitcoin matures.
 Usman Salis