 Saad Ullah
Cardano has been facing mounting pressure in recent trading sessions, with technical patterns suggesting a shift in momentum. After weeks of sideways movement, ADA has finally broken out of its consolidation phase, but unfortunately for bulls, the breakout has been to the downside. This development has traders and investors closely monitoring key support levels that could determine the cryptocurrency's next major move.
ADA Price Action Signals Breakdown
Popular trader @Nebraskangooner pointed out that ADA has broken down from a descending triangle pattern - typically a bearish signal that suggests more downside could be coming. Right now, Cardano is trading around $0.8132, struggling to get back above the $0.85 resistance level that's now acting like a lid on any upward moves.
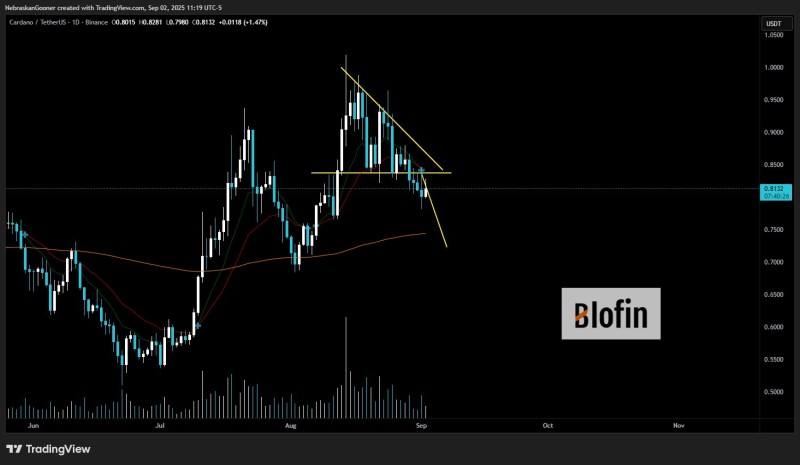
The charts are pointing to the 99-SMA as the next important test. This could offer some temporary support, but if ADA can't hold there, we might see it drop toward the $0.70 area.
This breakdown happened after weeks of ADA going sideways, unable to build any real momentum despite some earlier bullish attempts. Trading volume shows that sellers are stepping up, taking control in the short term.
There's still some support in the $0.78-$0.80 range, but if that doesn't hold, ADA could quickly move down to test the 99-SMA and potentially beyond. For bulls to regain control, we'd need to see ADA push back above $0.85 - that would be the first sign that the bearish setup might be failing.
What ADA Holders Should Watch
ADA investors should keep a close eye on the 99-SMA level since it's likely to determine where the price heads next. If it holds up, ADA might bounce and go back into sideways trading. If it breaks, we could see more downside.
It's not just about ADA's chart though - broader market conditions, Bitcoin's performance, and overall sentiment toward altcoins are all playing a role in where the price goes from here.
 Saad Ullah


