 Peter Smith
⬤ Silver just made history. In November 2025, monthly average prices hit $50.4 per ounce—a level never seen before in more than six decades of tracking. That's a massive 64% gain since January, pushing XAG past every previous peak on record. The long-term chart going back to 1960 really puts this into perspective, showing how this recent surge has topped even the famous rallies of 1980 and 2011.
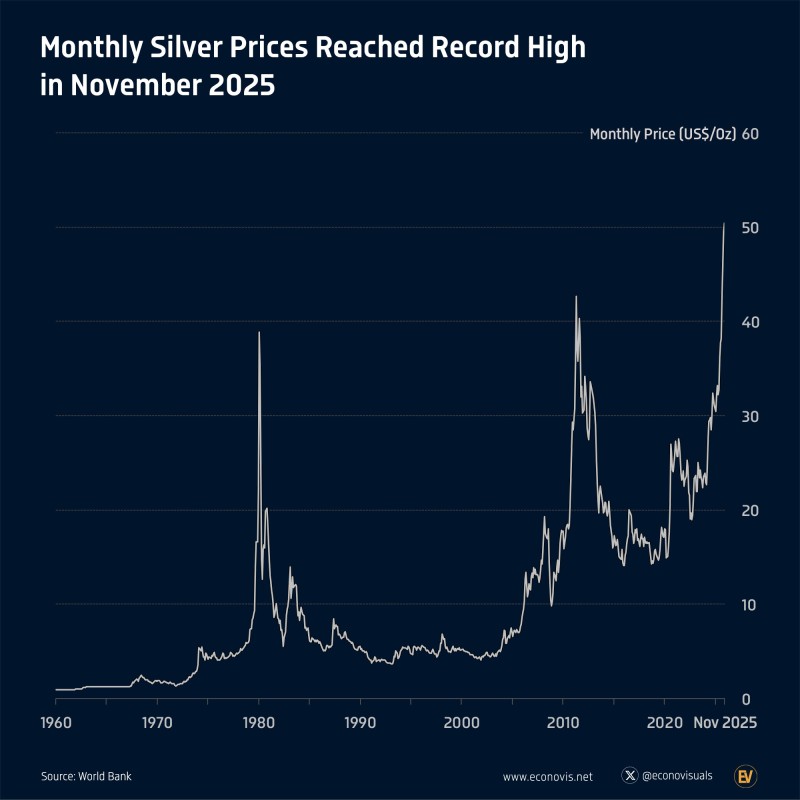
⬤ Looking at silver's six-decade journey, you can see long stretches of quiet trading broken up by dramatic spikes during commodity booms. The biggest historical moment came in the late 1970s when prices shot up near $49 before crashing back down. Then in 2011, we saw another spike that briefly touched $45 before cooling off. But this 2025 rally? It's different. The climb has been steeper and more sustained, with silver smashing through old resistance levels and setting an entirely new benchmark.
⬤ The visual data makes it crystal clear—silver's appreciation through 2025 has been unusually rapid and consistent. While we can't pinpoint exact causes from the chart alone, what's obvious is that this ranks among the strongest, most uninterrupted moves in modern silver history. The steady march toward $50 shows a fundamental repricing compared to earlier eras, when gains tended to unfold more gradually and cyclically.
⬤ Breaking records in precious metals typically signals something bigger is happening—whether it's changing economic conditions, shifting demand patterns, or growing appetite for safe-haven assets. With XAG now sitting above every historical benchmark, November 2025 marks a defining moment. It's a new chapter for silver's long-term story and a fresh indicator of how this metal fits into today's global commodity markets.
 Peter Smith


