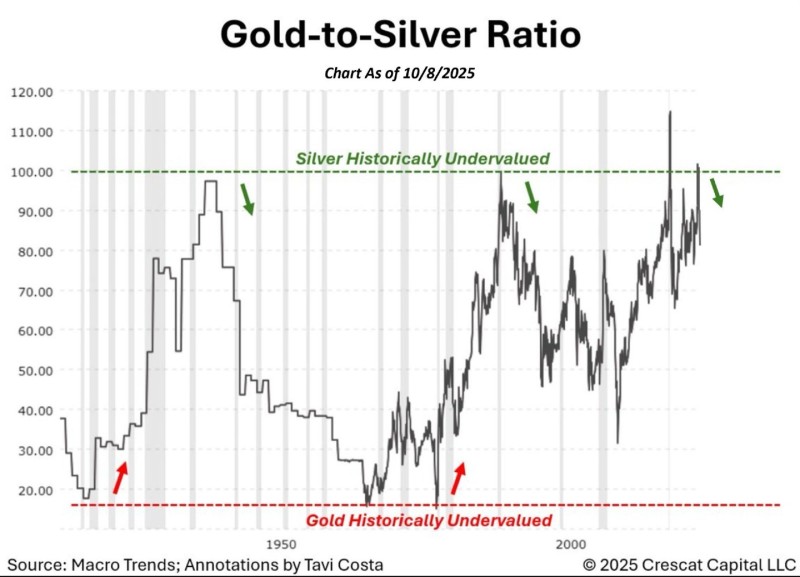
The Gold-to-Silver ratio has pushed back above the 80:1 mark, a level that's historically flagged silver as undervalued compared to its golden counterpart. With gold trading around $4,200 per ounce and silver at $52, the ratio sits near 80.7, sparking debate about whether silver is gearing up for a stronger run.
Gold-to-Silver Ratio at Critical Juncture
Looking at the long-term chart, you can see distinct cycles where one metal clearly outperformed the other. Ratios above 80 have typically meant silver was cheap relative to gold, while drops closer to 20 marked times when gold had more room to run. What we're seeing now mirrors past setups that eventually led to silver catching up.
According to Stock Sharks trader analysis, this divergence creates an interesting relative value play, especially as investors pile into precious metals amid ongoing global uncertainty.

The 1940s and '50s saw the ratio hovering near 20, pointing to gold being undervalued at the time. Later in the 20th century, extreme ratio spikes pushed silver into bargain territory before sharp reversals kicked in. During the 2008 financial crisis, silver surged after the ratio collapsed from extreme highs.
Today's environment adds more layers to consider. Central banks keep adding gold to their reserves as protection against currency instability. Meanwhile, industrial demand for silver stays strong, driven by renewable energy and electronics manufacturing. Add in inflationary pressure and loose monetary policy, and you've got growing appetite for hard assets across the board.
What's Next for Silver?
If silver builds momentum and pushes toward $60, the gold-to-silver ratio could narrow, potentially kicking off a cycle where silver outperforms. But if gold continues dominating as the go-to safe haven, the ratio might stay elevated longer than silver bulls would like.
 Saad Ullah

 Saad Ullah


