Usman Salis

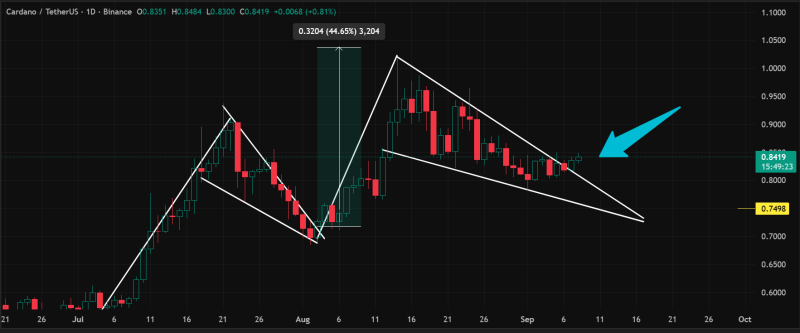
Cardano is capturing trader attention once again with a promising technical breakout. The cryptocurrency has pushed above a bull pennant formation—a pattern that typically signals trend continuation. When ADA last displayed this setup, it delivered an impressive 45% gain within weeks. With similar chart signals emerging, investors are wondering if we'll see history repeat itself or face another false breakout.
Technical Breakdown: Pennant Pattern Points Higher
The ADA/USDT daily chart reveals several key technical elements. ADA formed a bull pennant after its July rally, creating a narrowing triangle during consolidation. The recent upside breakout suggests renewed bullish momentum, with the previous pennant delivering a 44.65% surge from around $0.72 to above $1.05.
Critical resistance sits between $0.90 and $0.95, which must be cleared for further gains. Meanwhile, support near $0.75 remains crucial—a break below would invalidate the bullish setup. The broader trend shows ADA maintaining an uptrend since early July with consistent higher lows.
This technical picture aligns with observations from @TheCryptoLark, who noted similarities to ADA's July breakout pattern.
Market Context and Drivers
Several factors support the bullish case:
- Cardano's ongoing network upgrades and ecosystem expansion continue attracting new projects
- Altcoin rotation as Bitcoin stabilizes has benefited technically strong setups like ADA
- Market psychology favors ADA's historical tendency to break out after quiet consolidation periods
Bullish scenario: Sustained momentum above $0.95 could target $1.10-$1.20, mirroring July's performance.
Bearish scenario: Failure to hold above $0.83 and a drop below $0.75 would invalidate the breakout, likely leading to extended consolidation.
The technical setup looks promising, but as always in crypto, execution will determine whether this breakout delivers on its potential.
 Usman Salis