Usman Salis

After months of investor pessimism and market beatdowns, Intel might finally be turning the corner. The chip giant has been through hell this year, but recent technical analysis suggests the worst could be behind us. With the stock finding its footing above key support levels and momentum indicators starting to improve, bulls are beginning to take notice. The question isn't whether Intel can recover - it's whether this is the beginning of that recovery.
Chart Setup Shows Promise
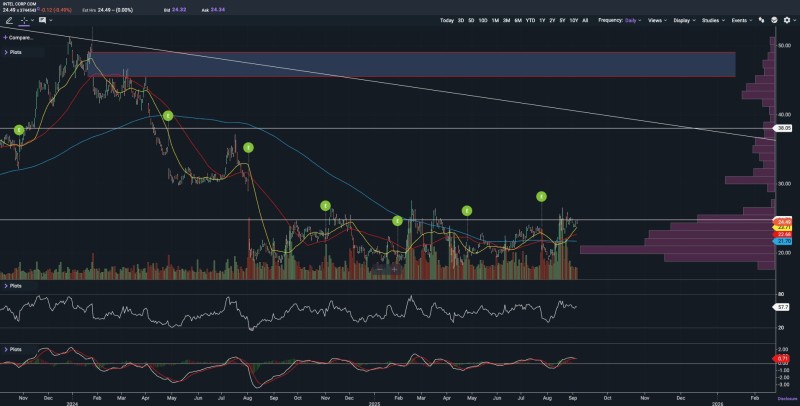
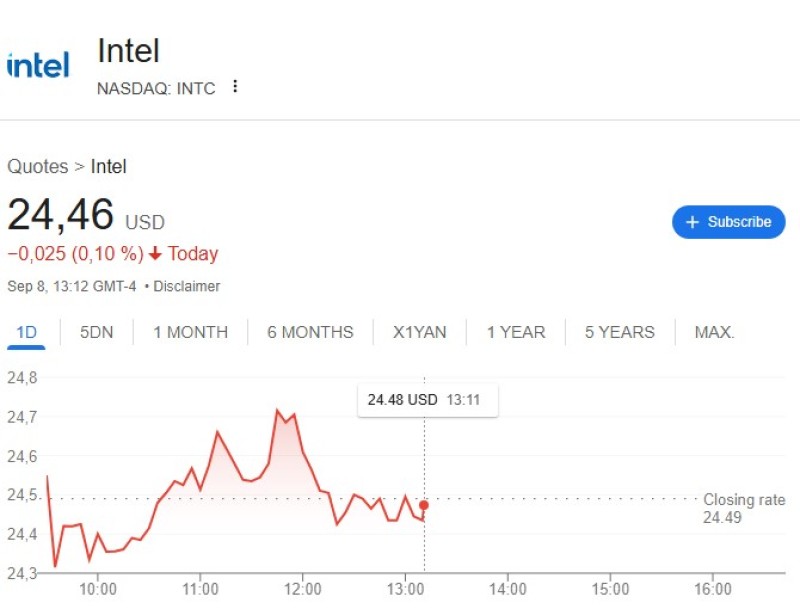
Intel's daily chart reveals the stock trading at $24.49, slightly down for the session but maintaining its position above critical moving averages. The technical picture is getting interesting. Strong support has formed around the $22-23 zone, where heavy trading volume suggests serious accumulation by institutional buyers. The first resistance target sits near $28-30, but the real prize is at $38 where the stock meets a major descending trendline that's been capping rallies all year.
The moving averages tell their own story - the 50-day and 200-day lines are tightening up, potentially setting up for a bullish crossover that could fuel the next leg higher. Meanwhile, momentum indicators are turning friendly with RSI at 57 (neutral-to-bullish territory) and MACD close to flipping positive.
Why the Turnaround Makes Sense
Intel's improving outlook isn't just about charts. The fundamentals are shifting too. The company is finally positioning itself to capitalize on AI infrastructure demand, something that seemed impossible just months ago. Recent cost-cutting measures have investors believing margins can recover, while the broader semiconductor cycle is turning up after a brutal downturn. According to @Eroswole_, this combination of technical stability and sector momentum makes Intel a compelling bullish play.
The AI revolution that initially left Intel behind is now creating opportunities, especially in data centers where the company still has significant presence. Plus, the efficiency measures implemented during the downturn should help margins once revenue starts growing again.
Critical levels to watch:
- Resistance: $28-30 zone, then major test at $38 trendline
- Support: $22-23 area with heavy volume clusters
- Breakout target: $45-50 region if $38 resistance falls
- Risk level: Break below $22 invalidates bullish case
What Happens Next
The next few weeks are crucial for Intel's recovery story. If the stock can push through that $28-30 resistance zone, bulls will likely make a run at the $38 trendline that's been the ceiling for months. A clean break above $38 would signal the start of a broader recovery phase, potentially opening the door to the $45-50 area.
But if Intel fails to hold above the $22 support level, the bullish thesis falls apart and the stock could face another leg down. For now though, the technical setup looks promising and the fundamental backdrop is finally turning supportive after a year of pain.
 Usman Salis